Start from a template, existing figure, or research idea. Edit labels, layers, colors, panels, microscopy annotations, and export-ready SVG layouts without rebuilding your figure in Illustrator.
Upload an SVG, choose a saved figure, or try the demo.
Open the scientific diagram workspace, choose a figure template, or bring in an existing research visual that needs revision.
Change wording, move objects, adjust colors, and keep scientific elements editable instead of locked inside a flat image.
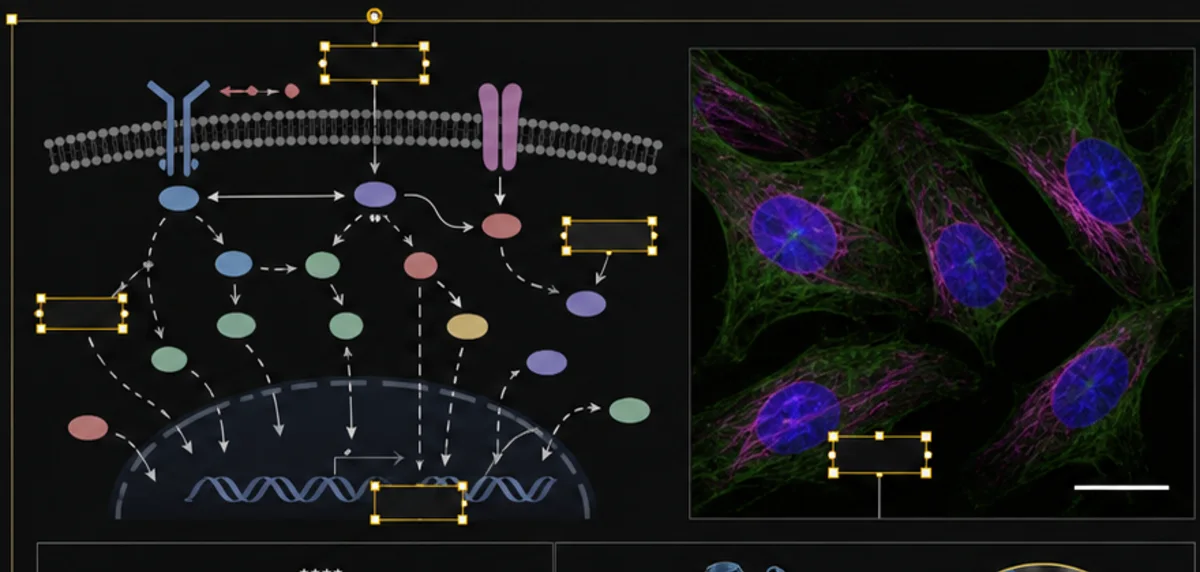
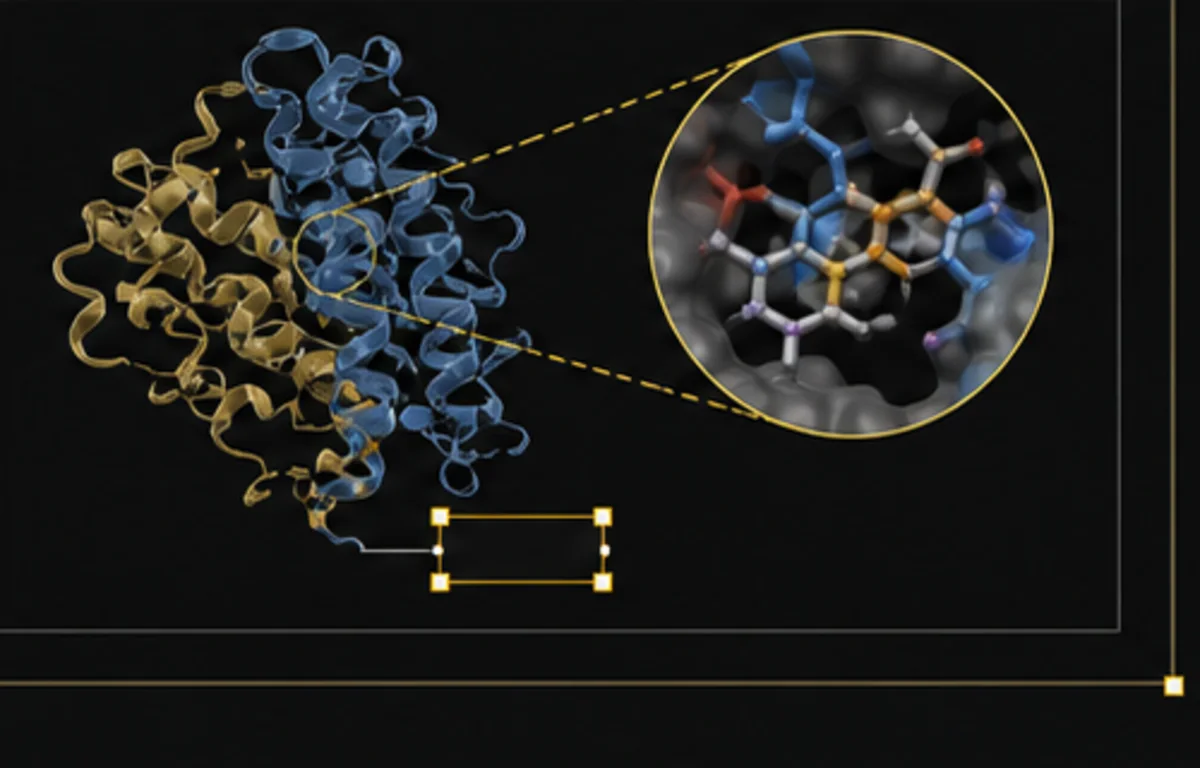
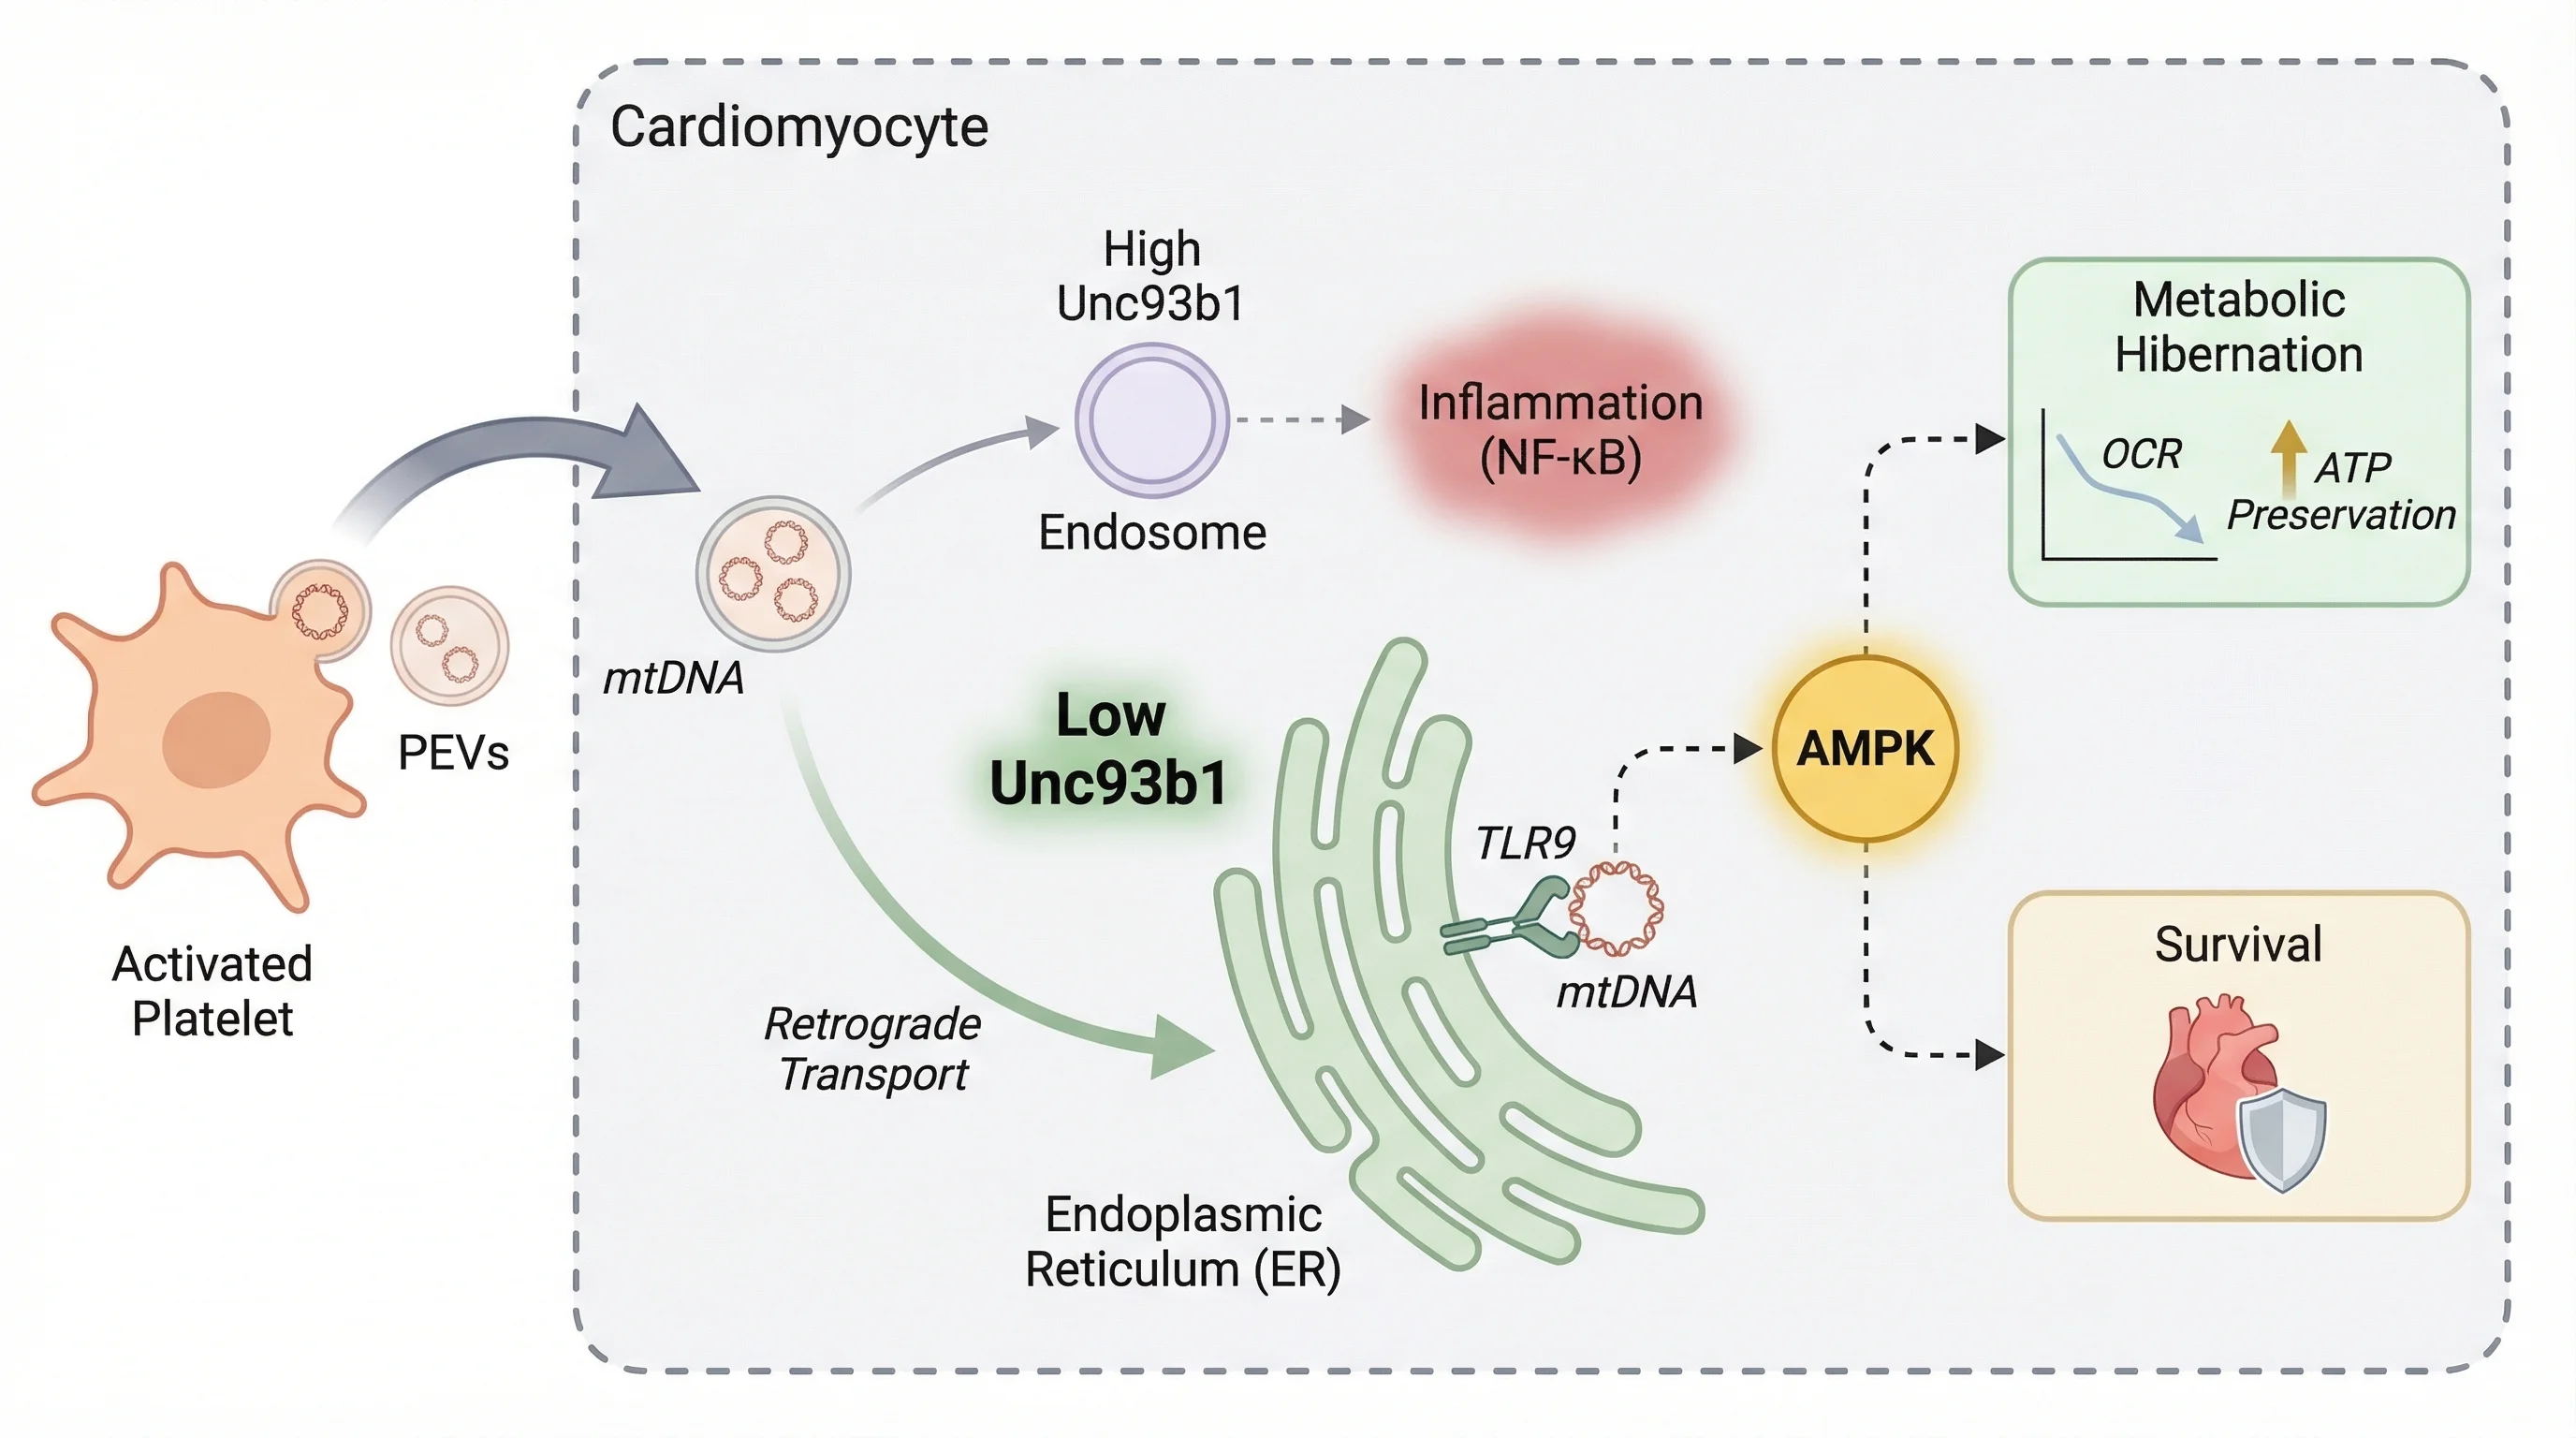
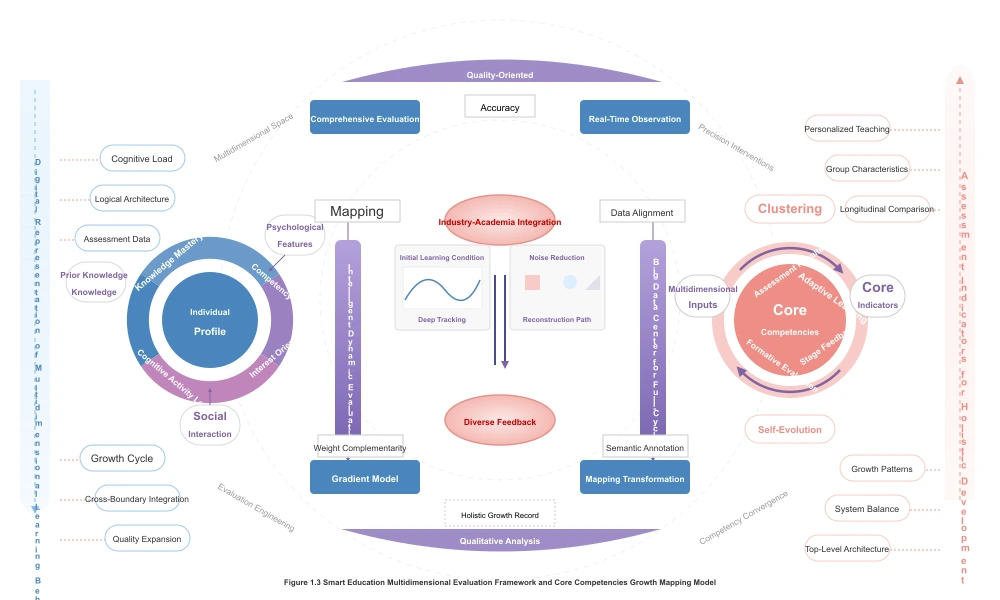
Combine mechanisms, microscopy images, charts, protein views, and callouts into a consistent manuscript figure.
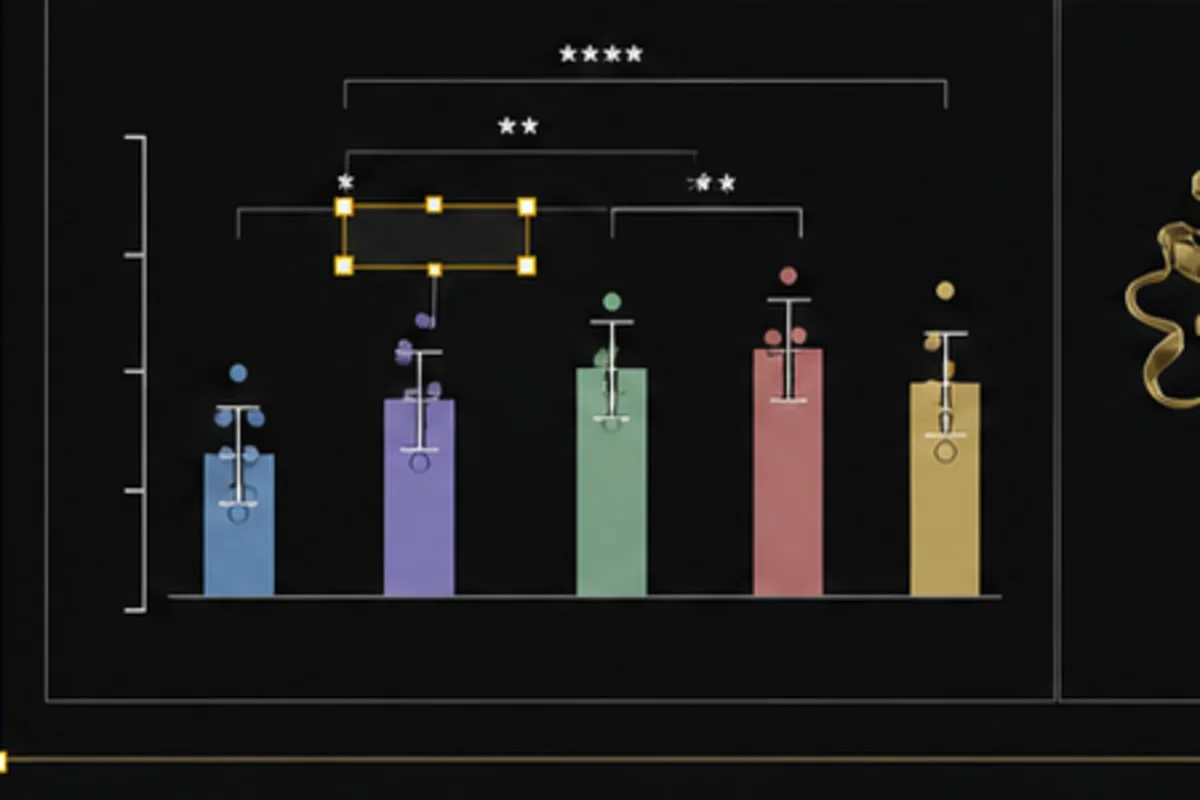
Add callouts, panel labels, scale-bar style annotations, and visual hierarchy for readers and reviewers.
Prepare clean visual assets for slides, grants, manuscript revision, and publication workflows.
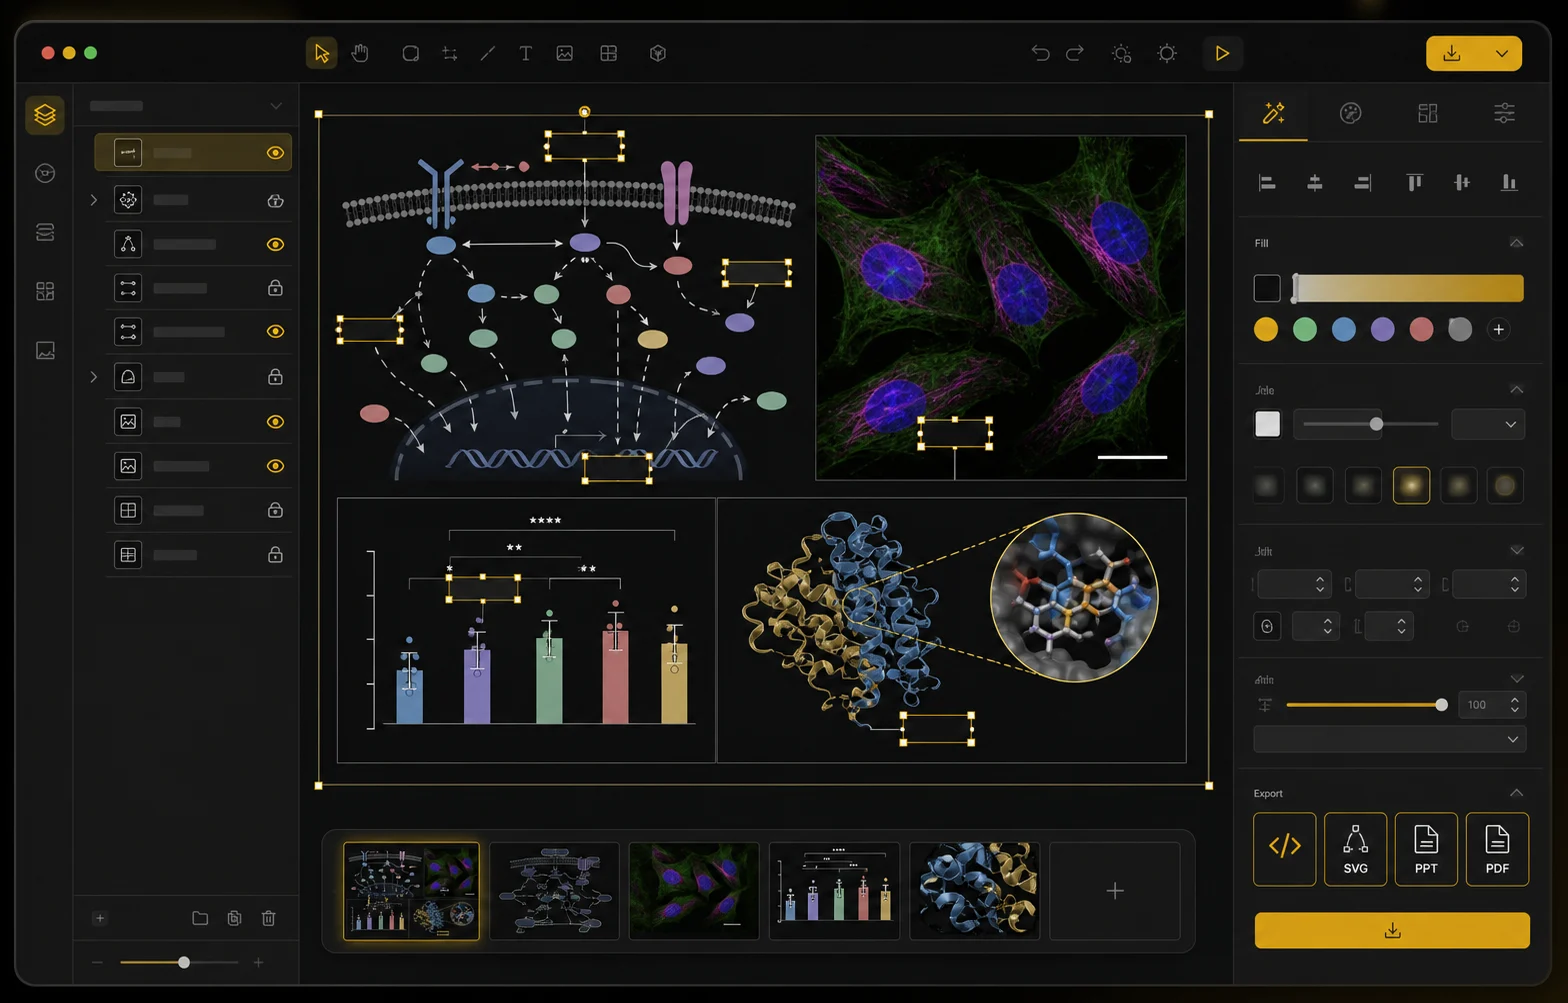
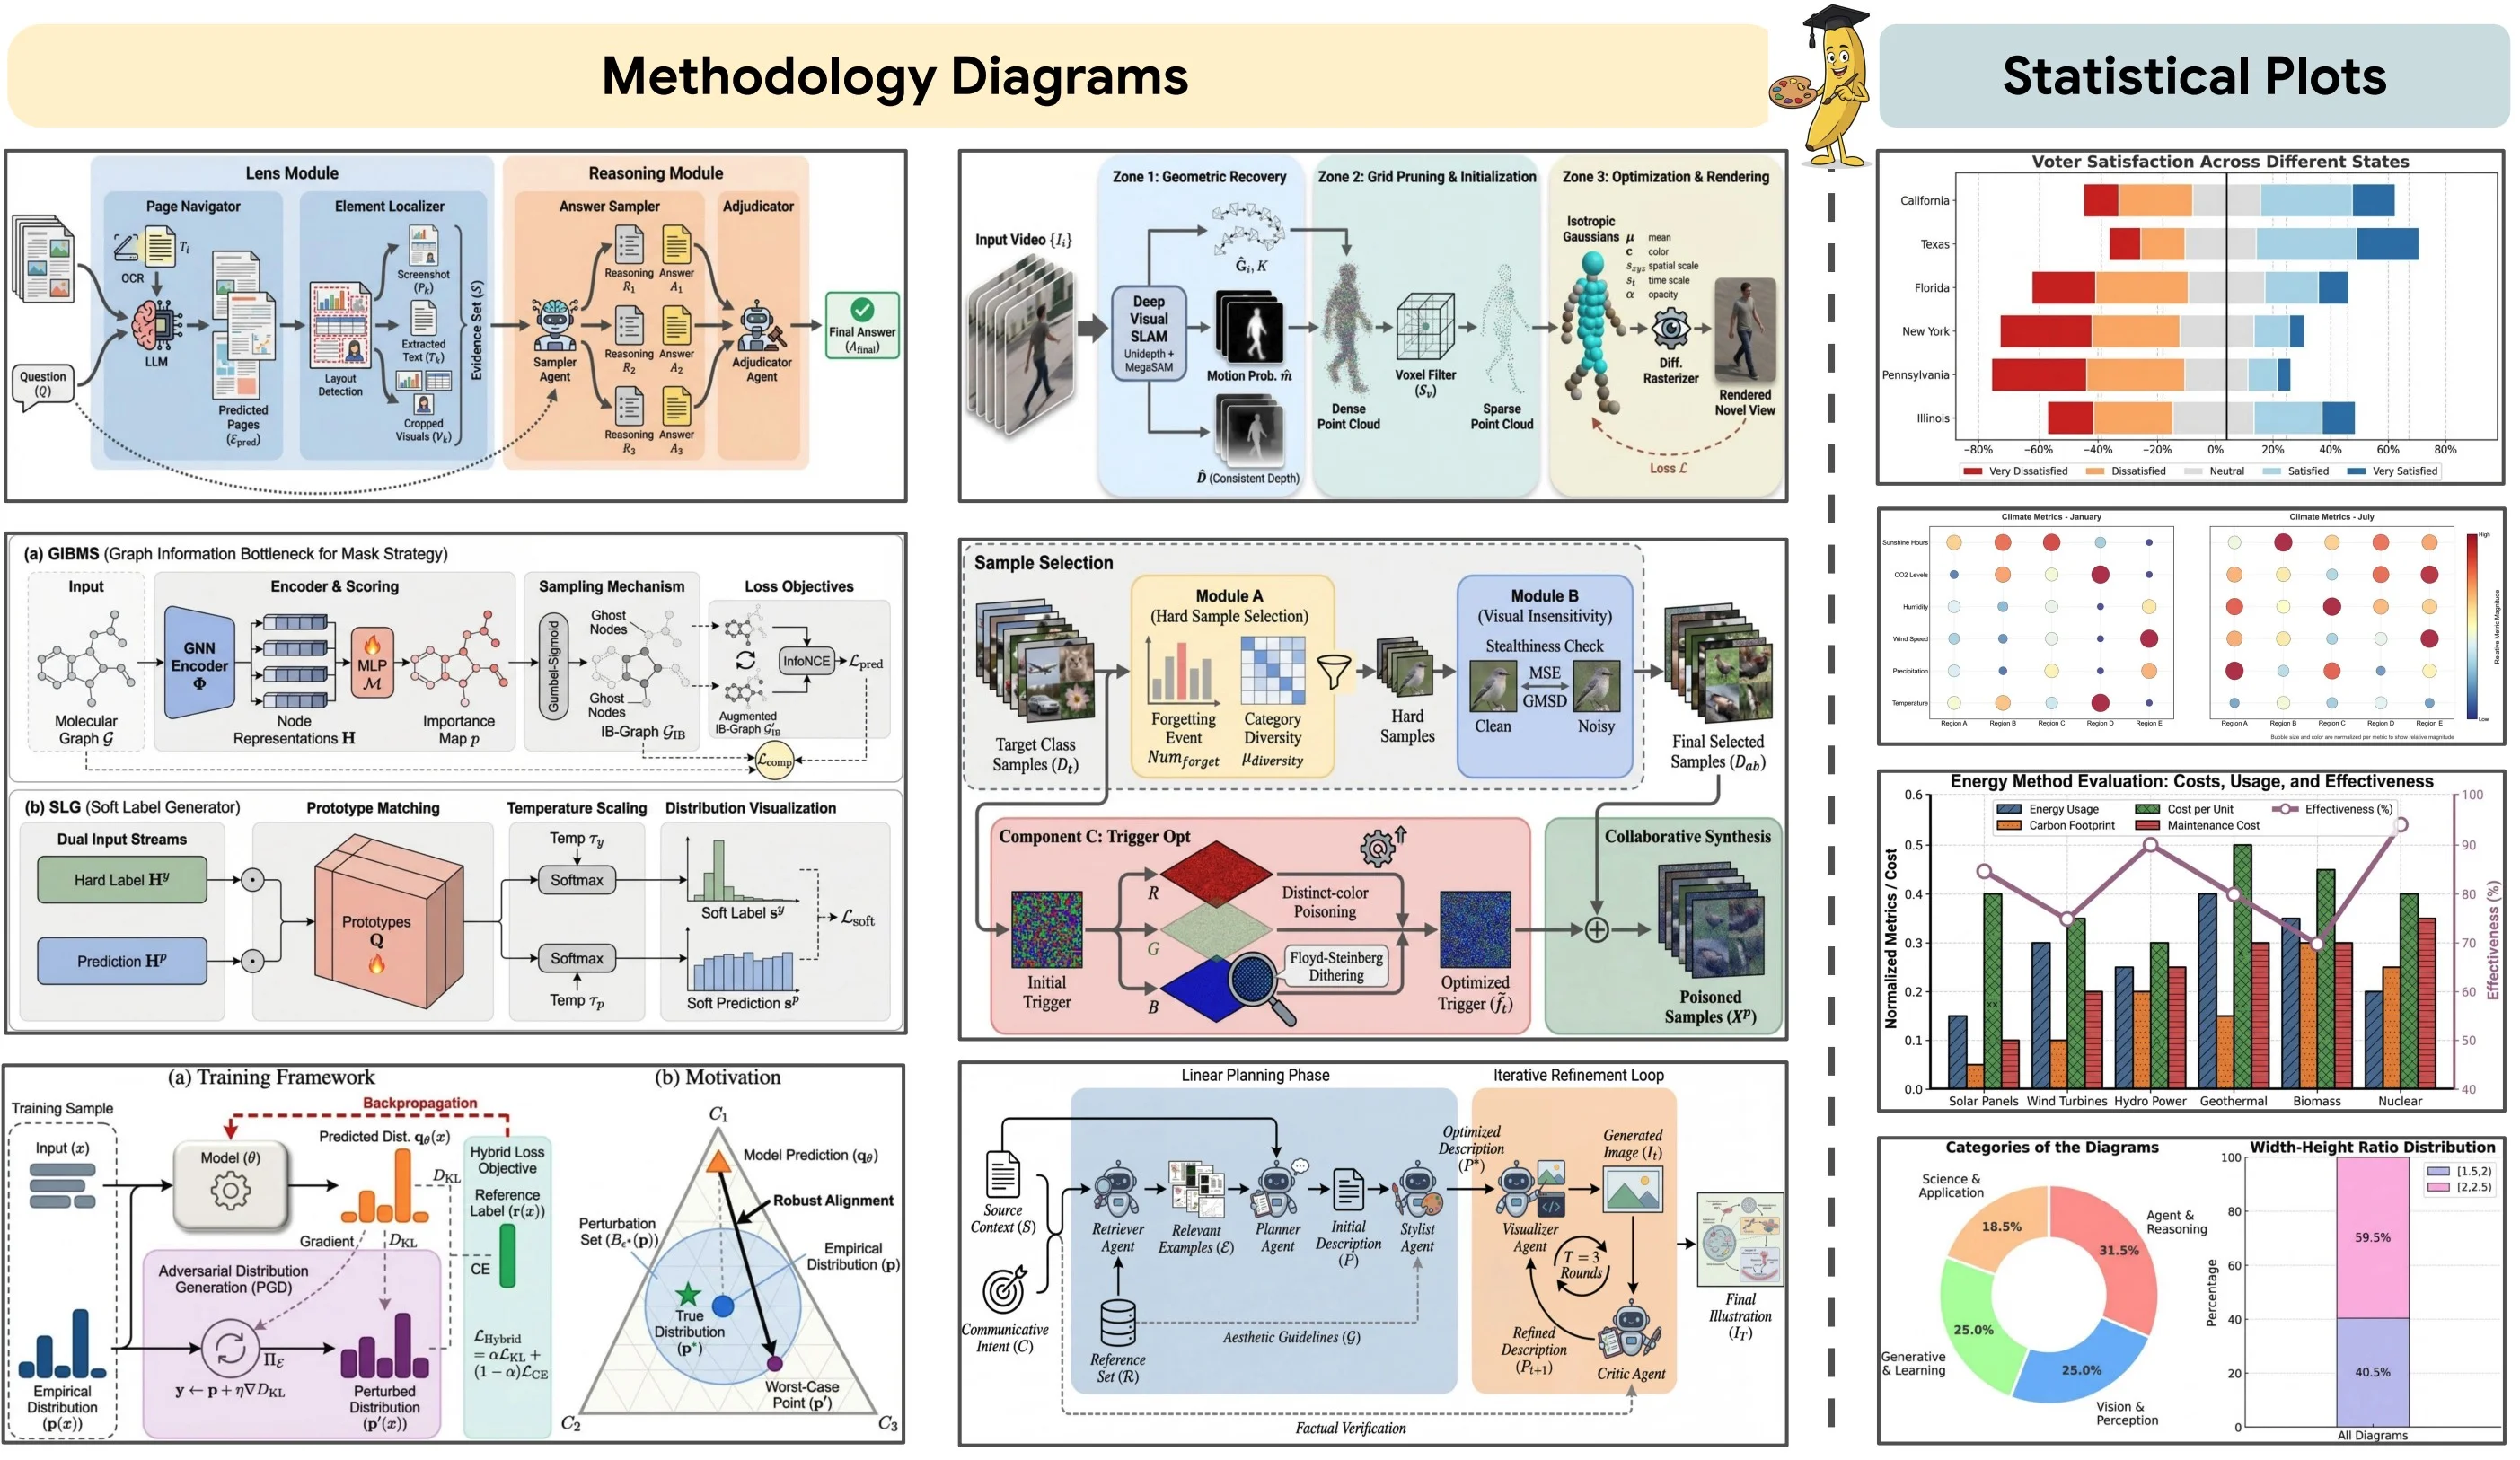
Arrange pathway diagrams, charts, microscopy panels, captions, and annotations into a clean manuscript figure with editable labels and consistent spacing.
Edit multi-panel scientific figures online
Arrange pathway diagrams, charts, microscopy panels, captions, and annotations into a clean manuscript figure with editable labels and consistent spacing.
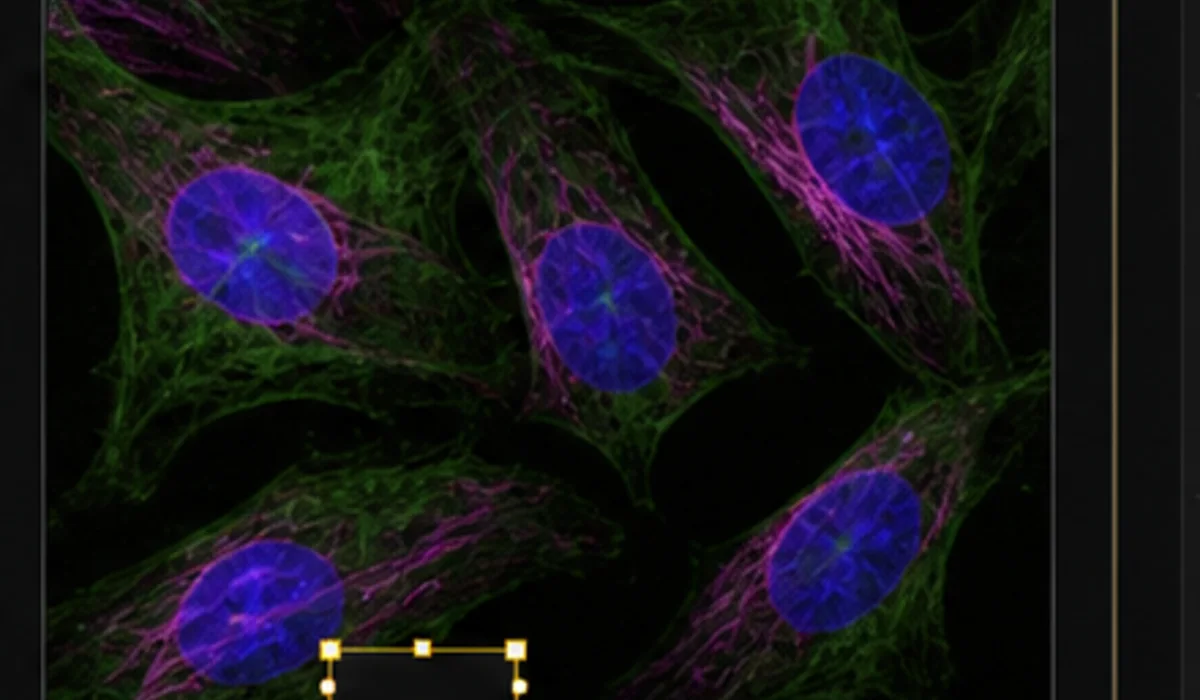
Add scale bars, panel labels, callouts, color overlays, and aligned image grids while preserving the original experimental image context.
Update labels, arrows, colors, panel order, and explanatory callouts after PI or reviewer comments instead of regenerating the whole figure.
Keep consistent visual language across papers, grants, and talks with editable templates for mechanisms, workflows, data panels, and graphical abstracts.
The workflow is designed for researchers who need precise control over labels, panels, diagrams, charts, and export formats before a paper, grant, or presentation deadline.
Scientific figure work is rarely one-and-done. The editor is built for the revision-heavy path from first draft to final manuscript visual.
Make common figure edits in the browser instead of opening a professional design app for every label or arrow change.
Keep the figure structured so PI feedback, reviewer comments, and lab revisions are easier to apply.
Use a workflow that understands diagrams, microscopy images, charts, callouts, and manuscript figure structure.
Align panels, tune color, balance visual hierarchy, and prepare clearer figures for readers and reviewers.
Create consistent figure styles across papers, grants, posters, talks, and internal lab documents.
Start with a structured figure layout instead of a blank slide or a locked AI image.
Keep diagrams, labels, callouts, charts, and panels adjustable throughout the revision process.
Prepare mechanisms, microscopy panels, charts, and graphical abstracts for papers, talks, grants, and lab review.
| Figure Need | Scientific Figure Editor | Manual Workflow | Result |
|---|---|---|---|
| Label revisions | Editable labels and callouts | Regenerate or redraw | Less rework |
| Panel assembly | Structured multi-panel workspace | PowerPoint alignment | Cleaner figures |
| Scientific diagrams | Template-based SVG editing | Illustrator or Inkscape | Lower learning curve |
| PI feedback | Editable review workflow | Flat PNG loops | Faster revisions |
Answers for researchers comparing PaperBanana with BioRender, Illustrator, PowerPoint, Inkscape, and generic AI image tools
Move from AI figure generation to editable diagrams and conference posters with crawlable links between every core PaperBanana tool.
Start from the main AI figure workspace for prompts, image edits, and research visual generation.
Generate publication-ready research figures from prompts, methods, and reference images.
Create template-based SVG diagrams with editable labels, layers, colors, and layouts.
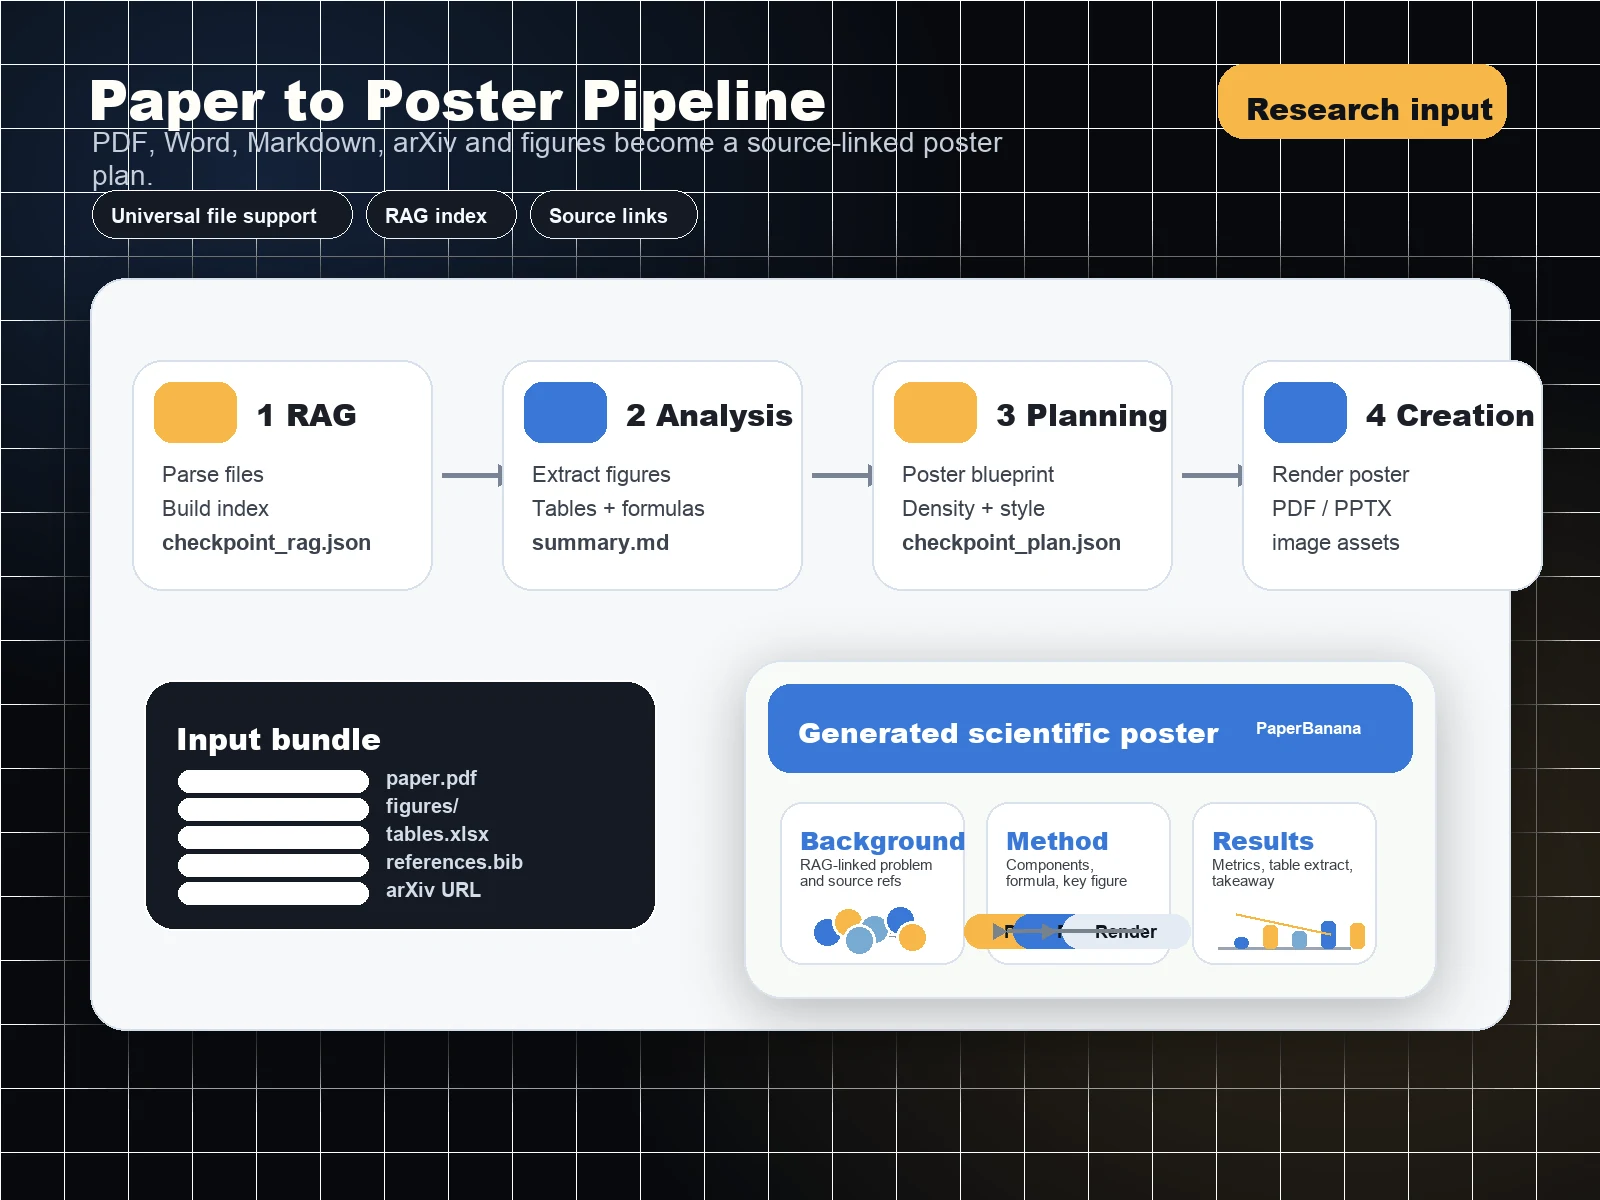
Turn PDF papers into conference-ready poster layouts.