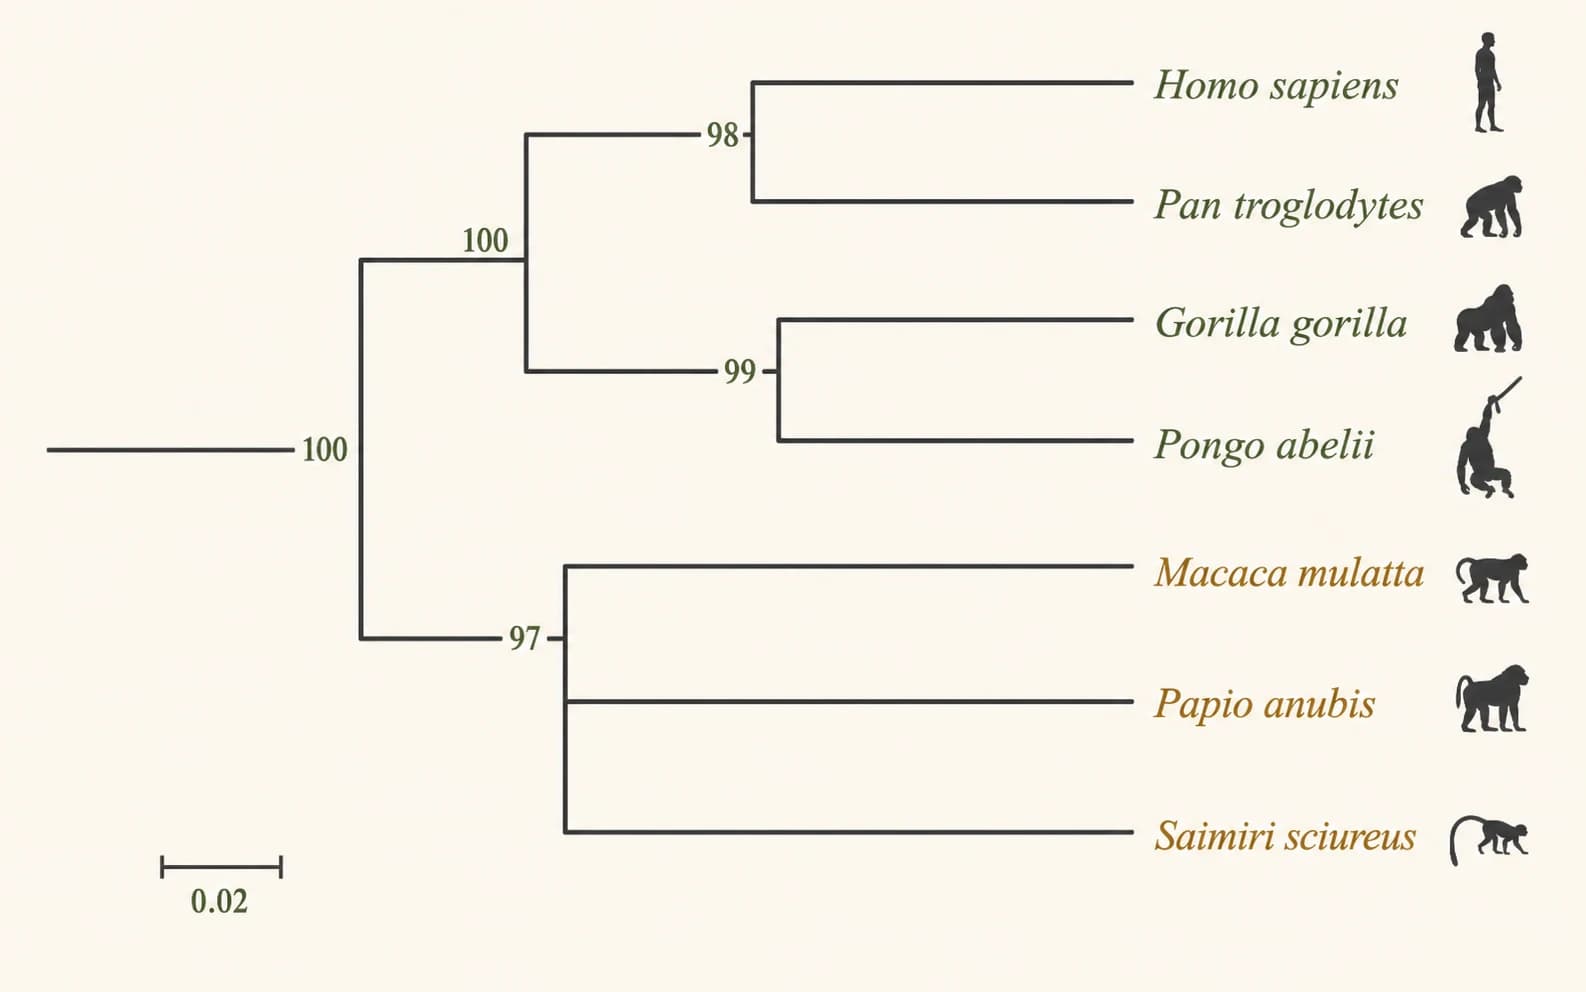
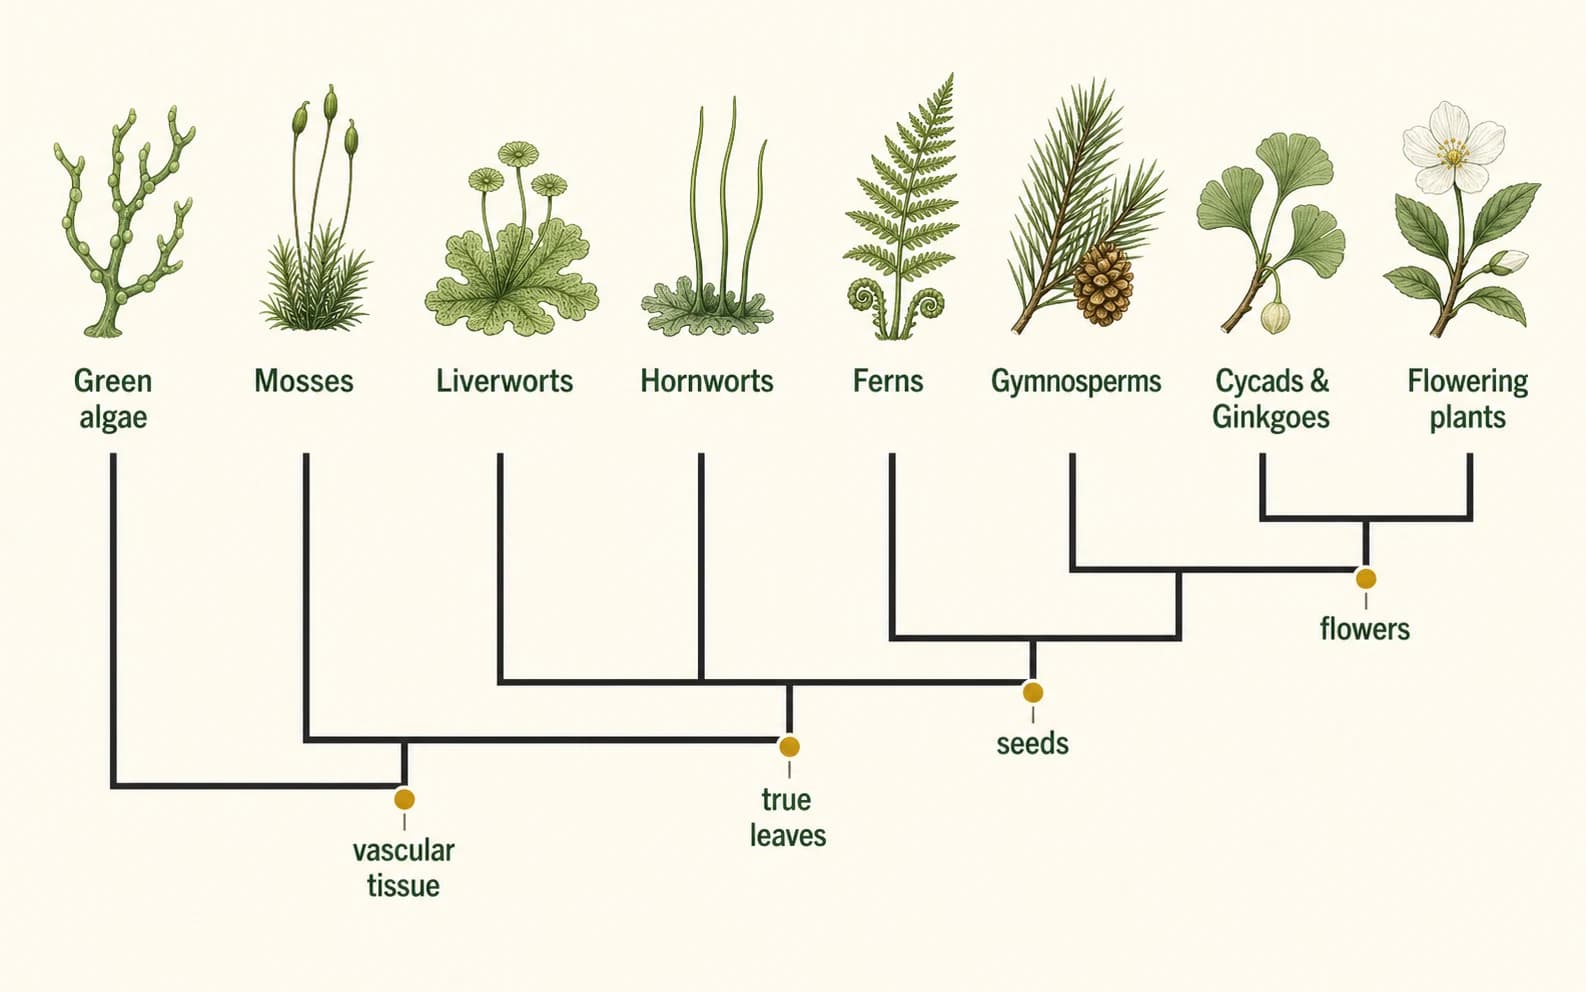
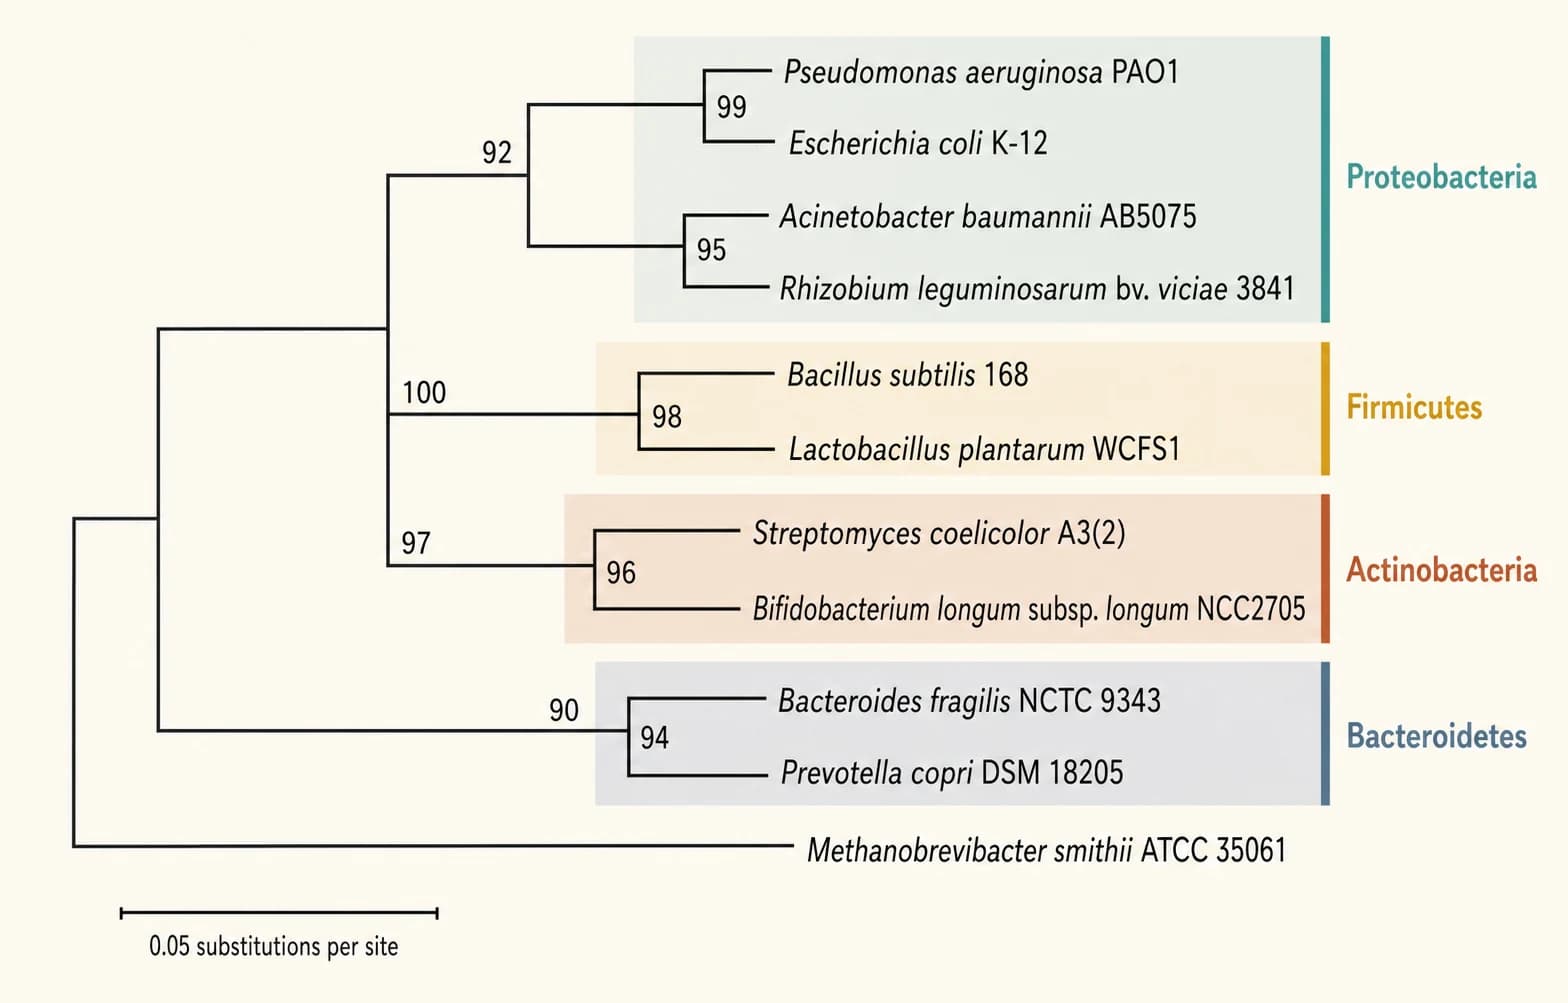
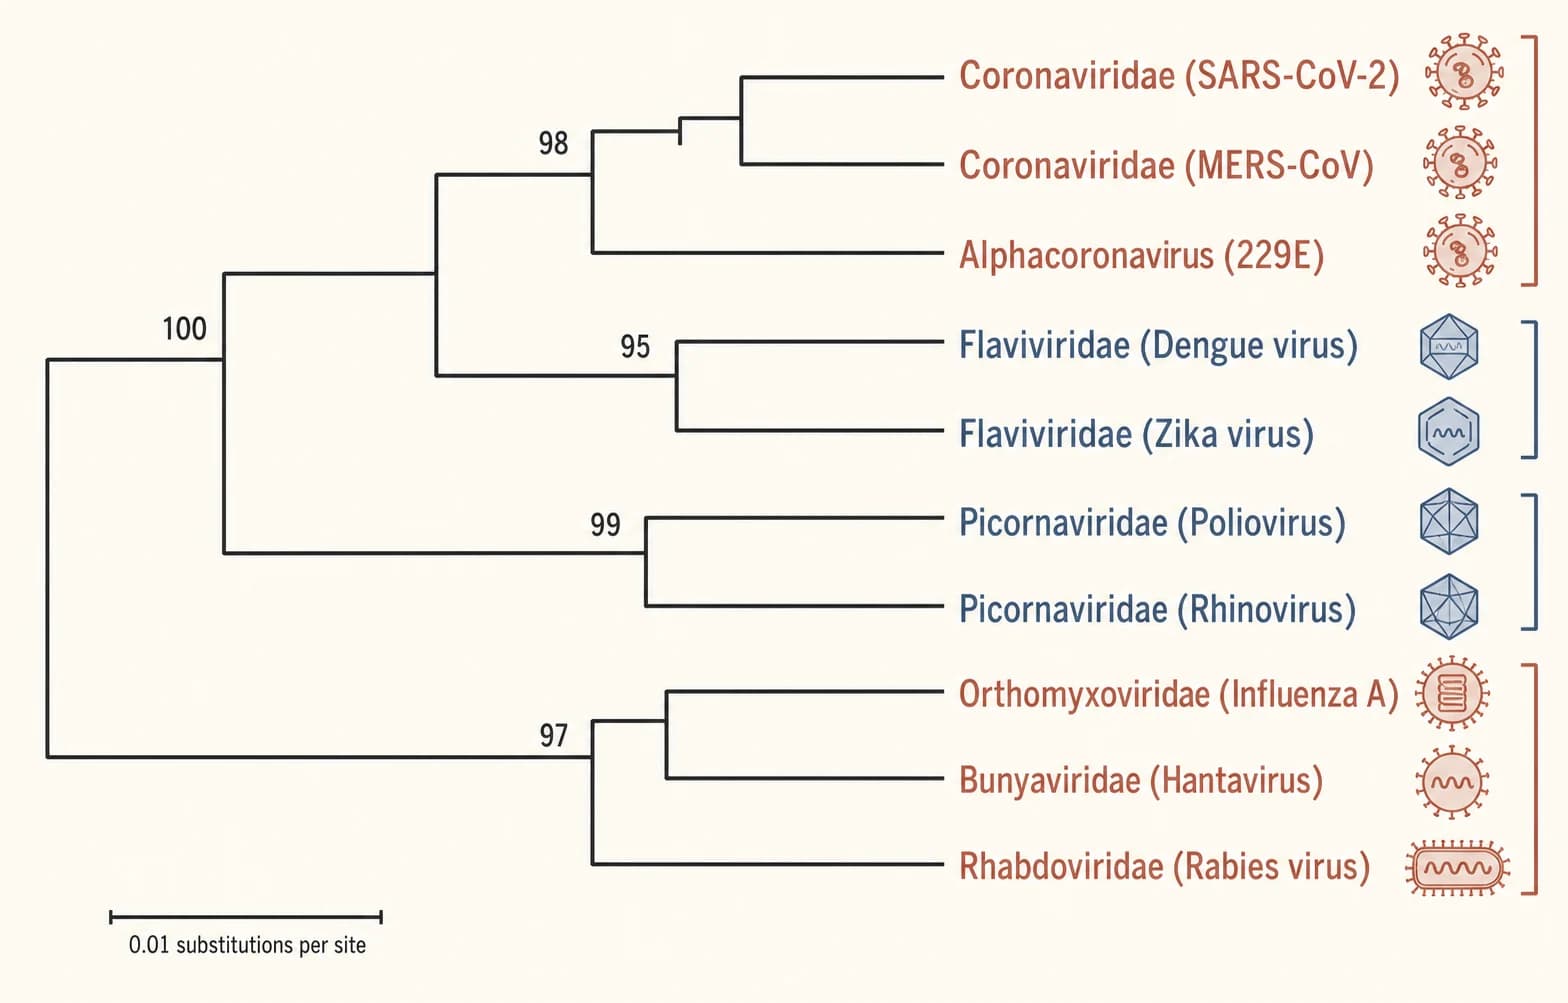
A phylogenetic tree is a branching diagram that represents a hypothesis about relationships among species, genes, populations, or other taxa. Leaf labels identify the sampled taxa, and the branching pattern is the topology. Internal nodes represent shared ancestors only when the tree has been biologically rooted.
A phylogram uses branch lengths to encode evolutionary change or another distance measure. A cladogram shows only the branching order, so its line lengths have no quantitative meaning. This tool supports both: Newick and aligned FASTA can preserve or calculate lengths, while species-list mode creates a visual cladogram.
Use the mode that matches your evidence. An existing Newick tree is ready for visualization; aligned homologous sequences can produce a basic UPGMA result; a plain list is useful for teaching or layout drafts, but it is not a molecular inference.
Taxa
Species, genes, strains, or populations shown at the terminal leaves.
Nodes
Branching points that represent hypothesized shared ancestors.
Topology
The branching order that determines which taxa form sister groups and clades.
Branch lengths
Optional values that can represent substitutions, genetic distance, or time.