Focused tools for creating, editing, and preparing research figures.
Create scientific illustrations, graphical abstracts, diagrams, and posters, or refine an existing figure.
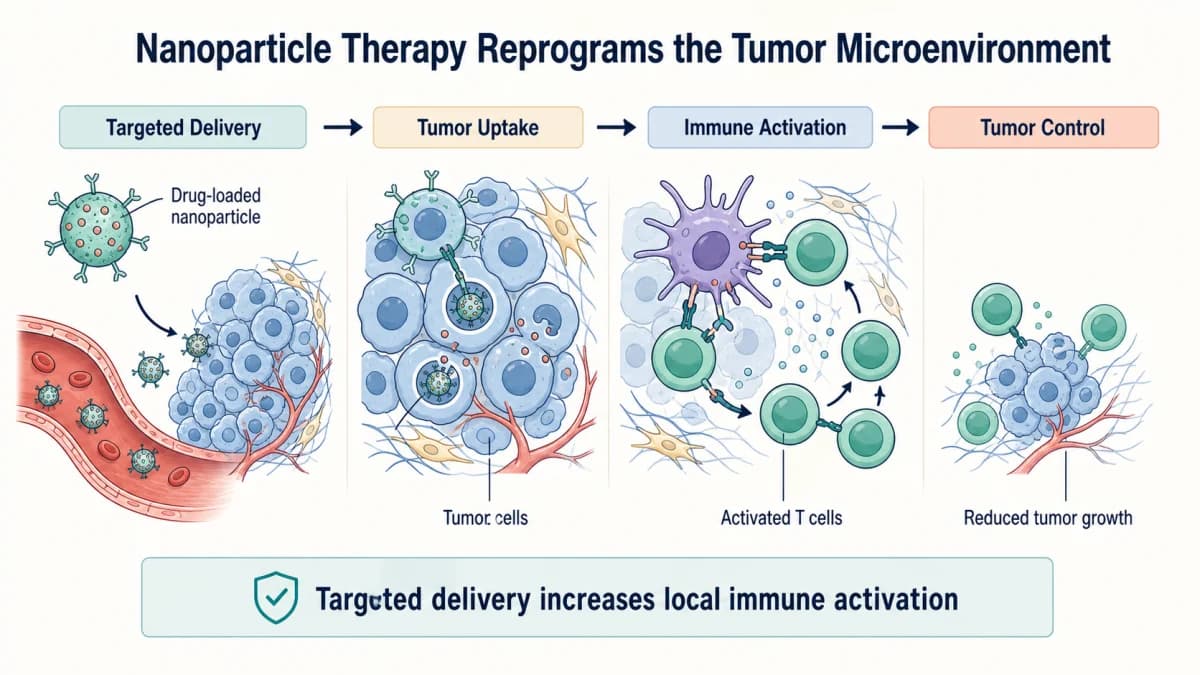
Paste an abstract or study summary to create a journal-ready visual story.
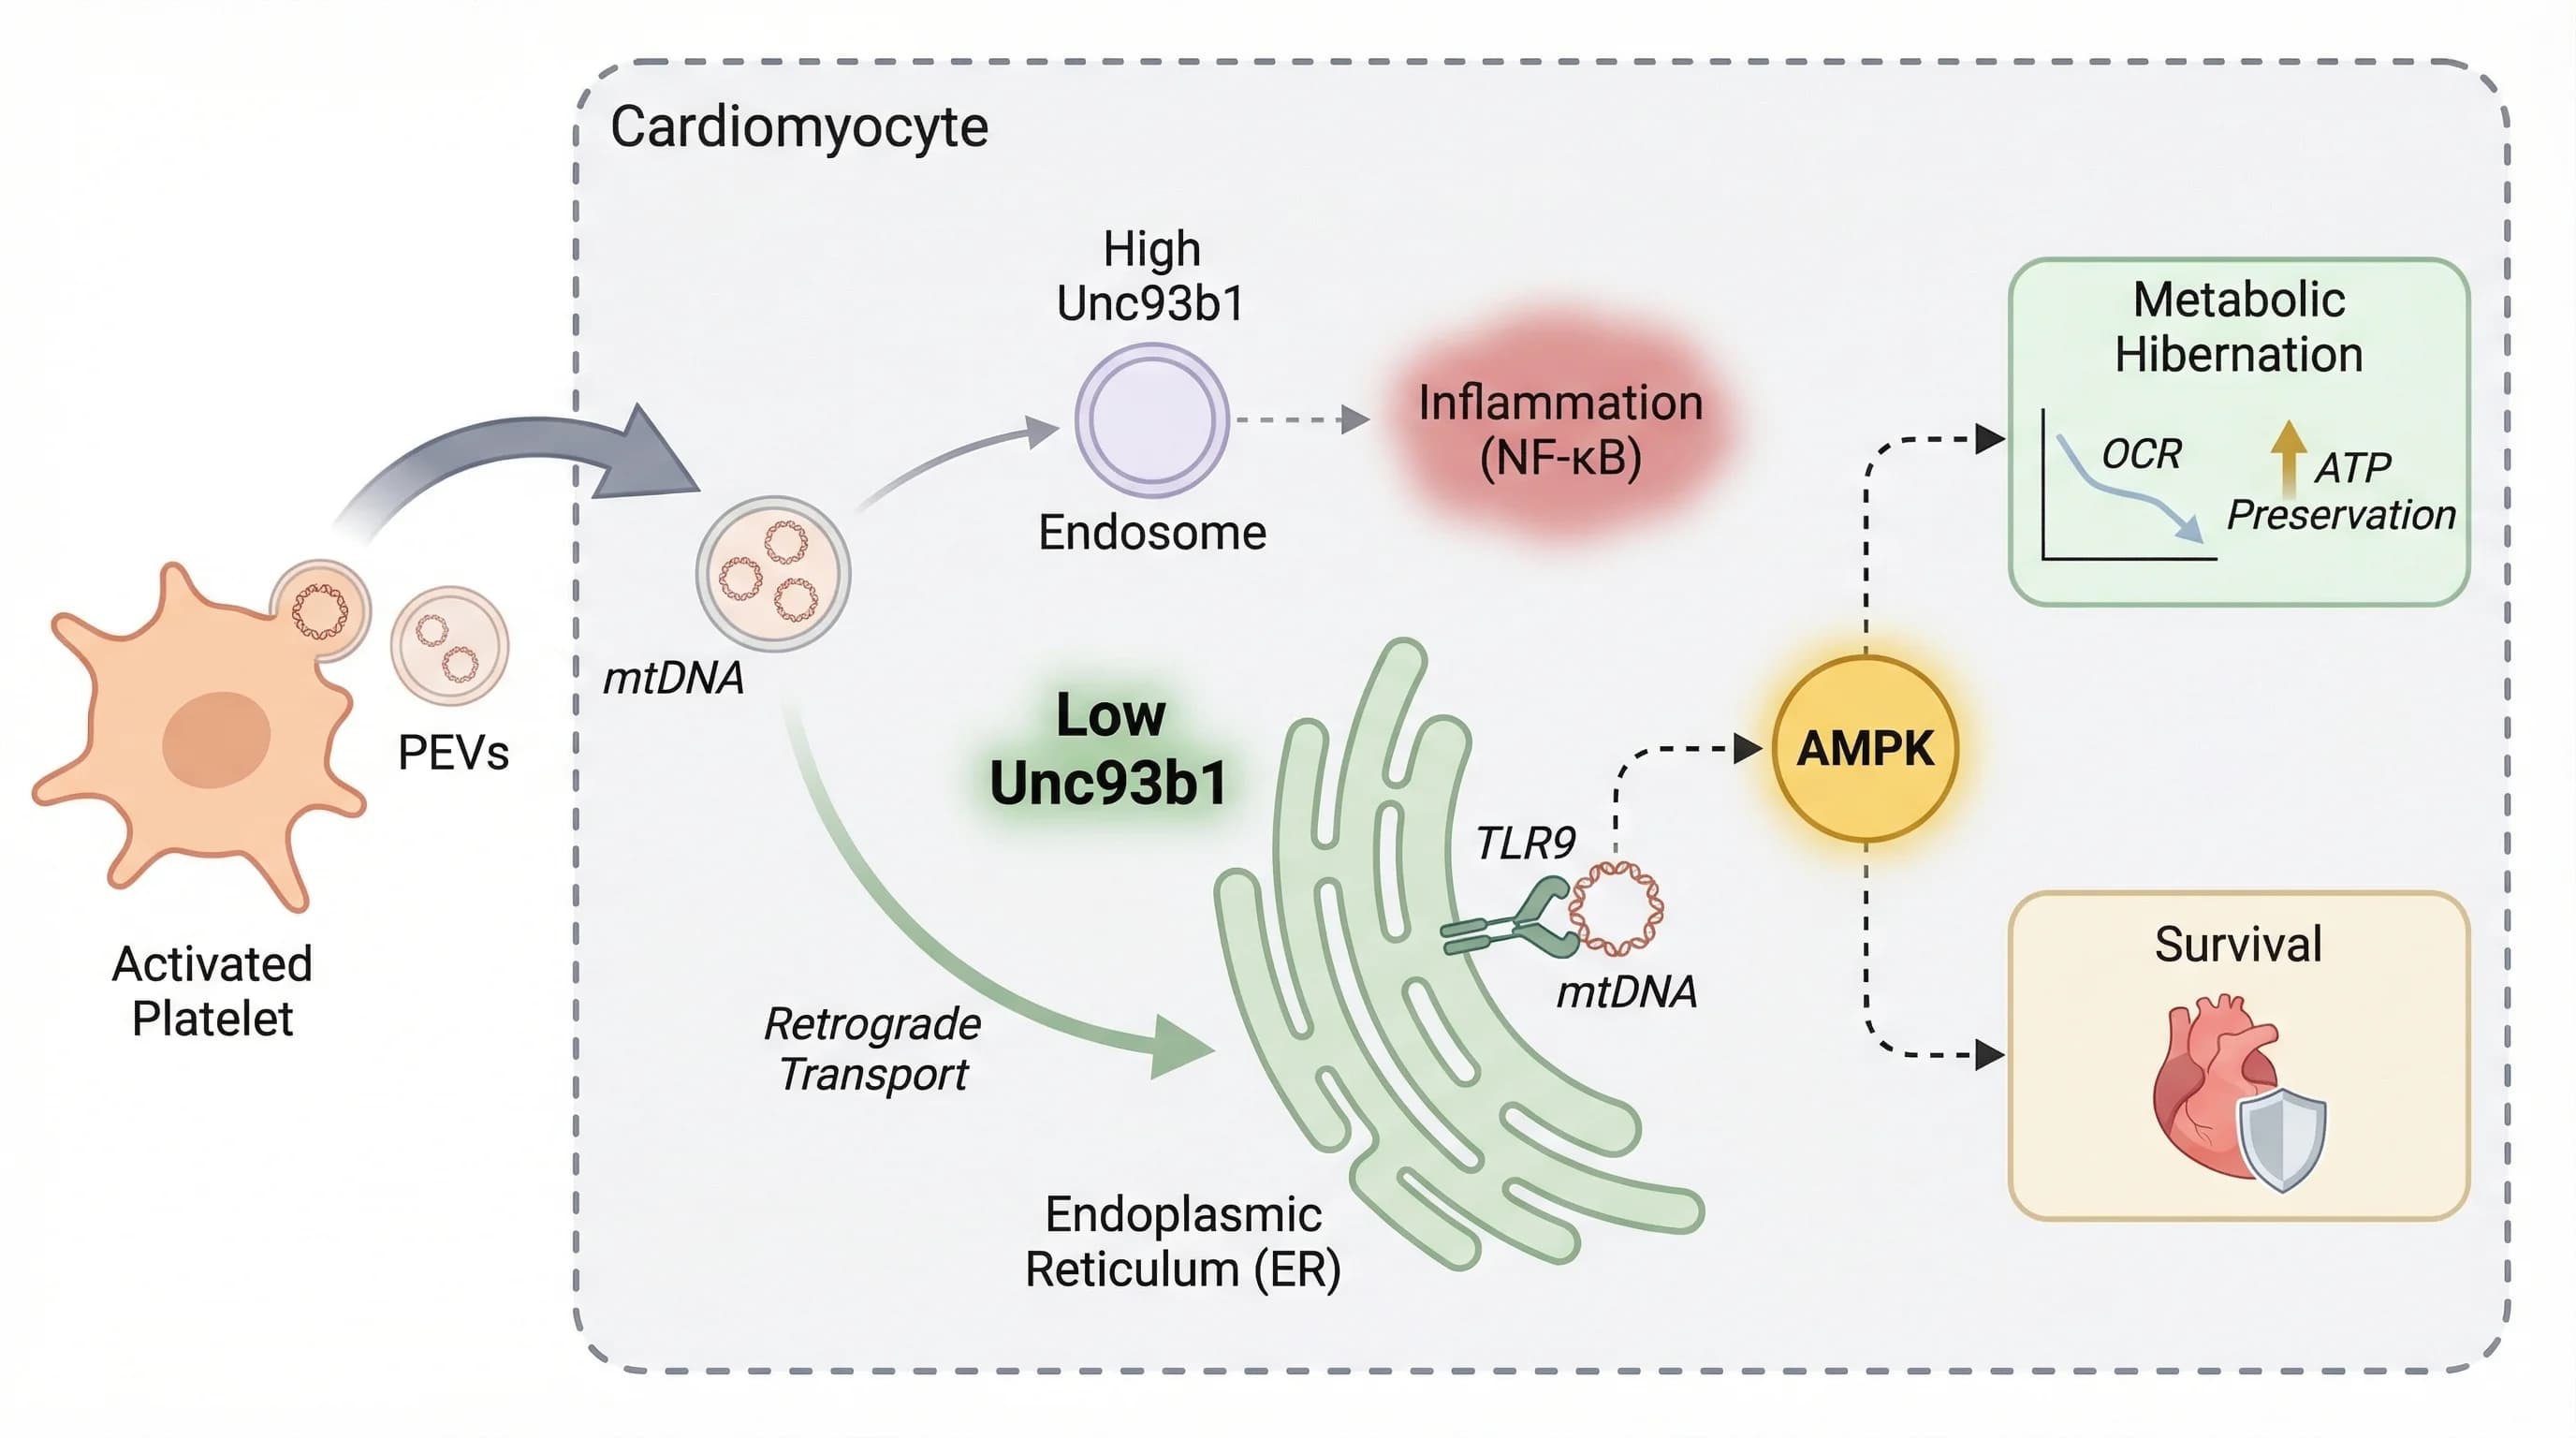
Turn a mechanism, method, sketch, or reference into a publication-ready scientific illustration.
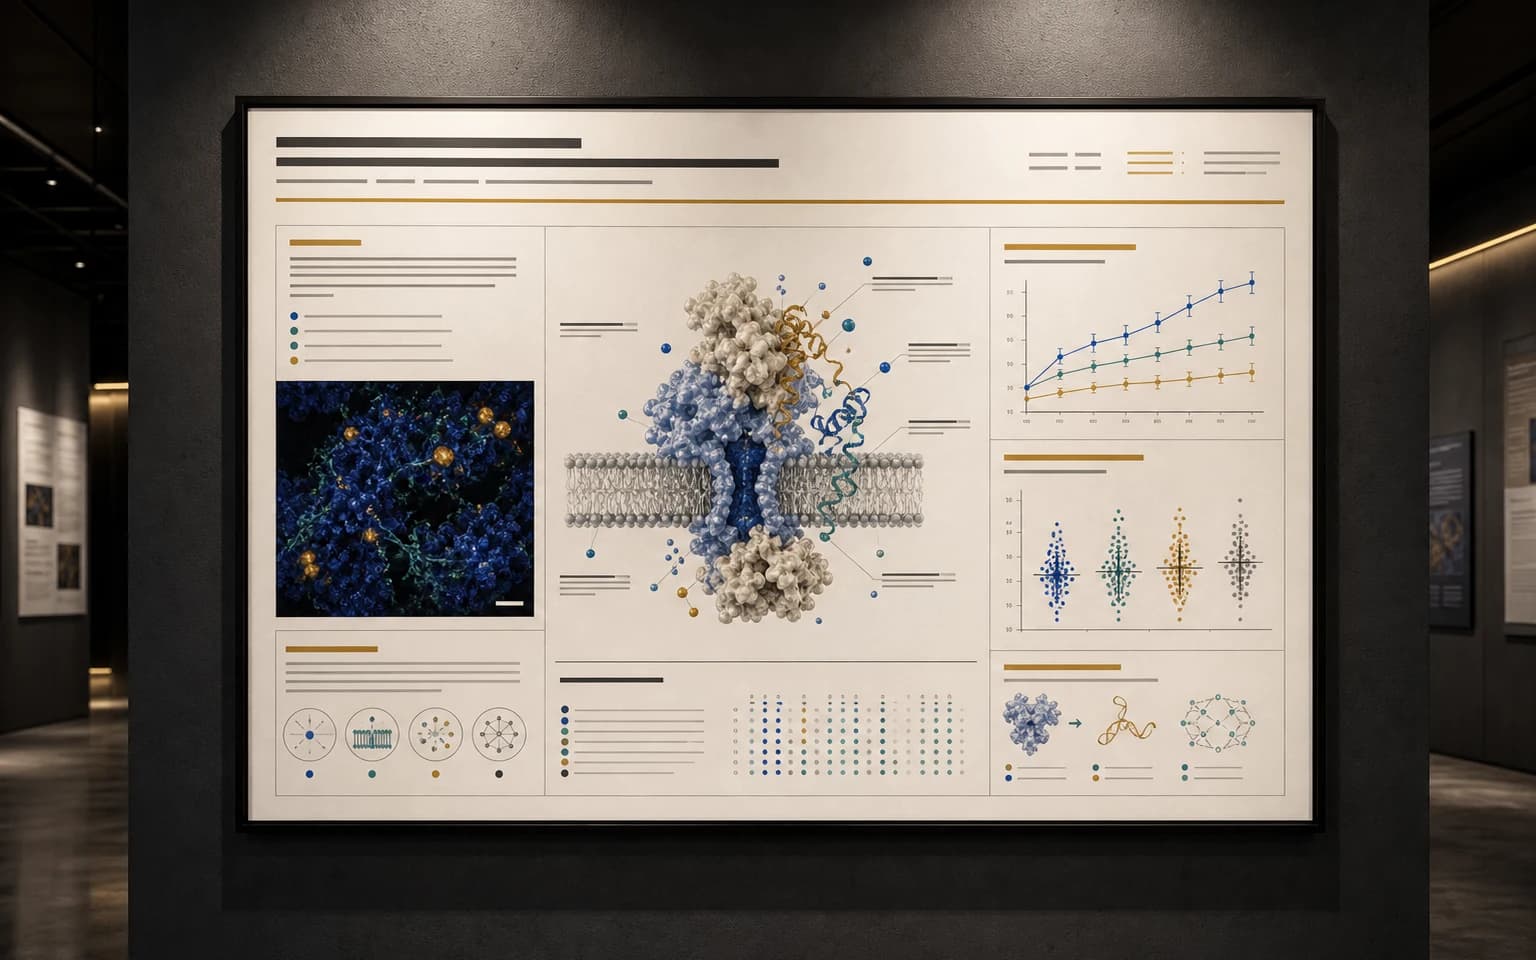
Upload a PDF paper to build an editable, conference-ready research poster.
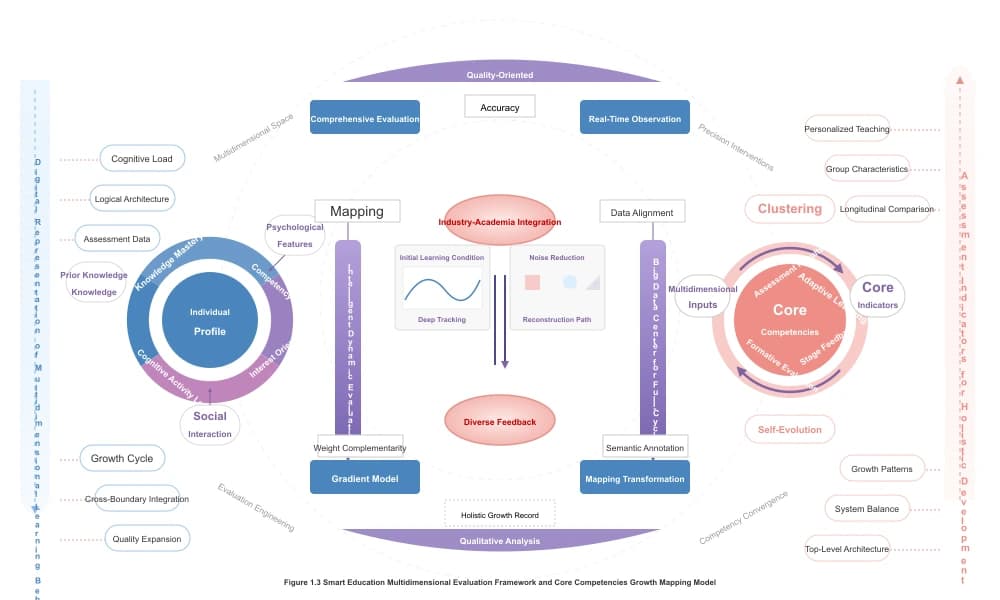
Build scientific diagrams from templates and customize their layout, labels, and shapes.
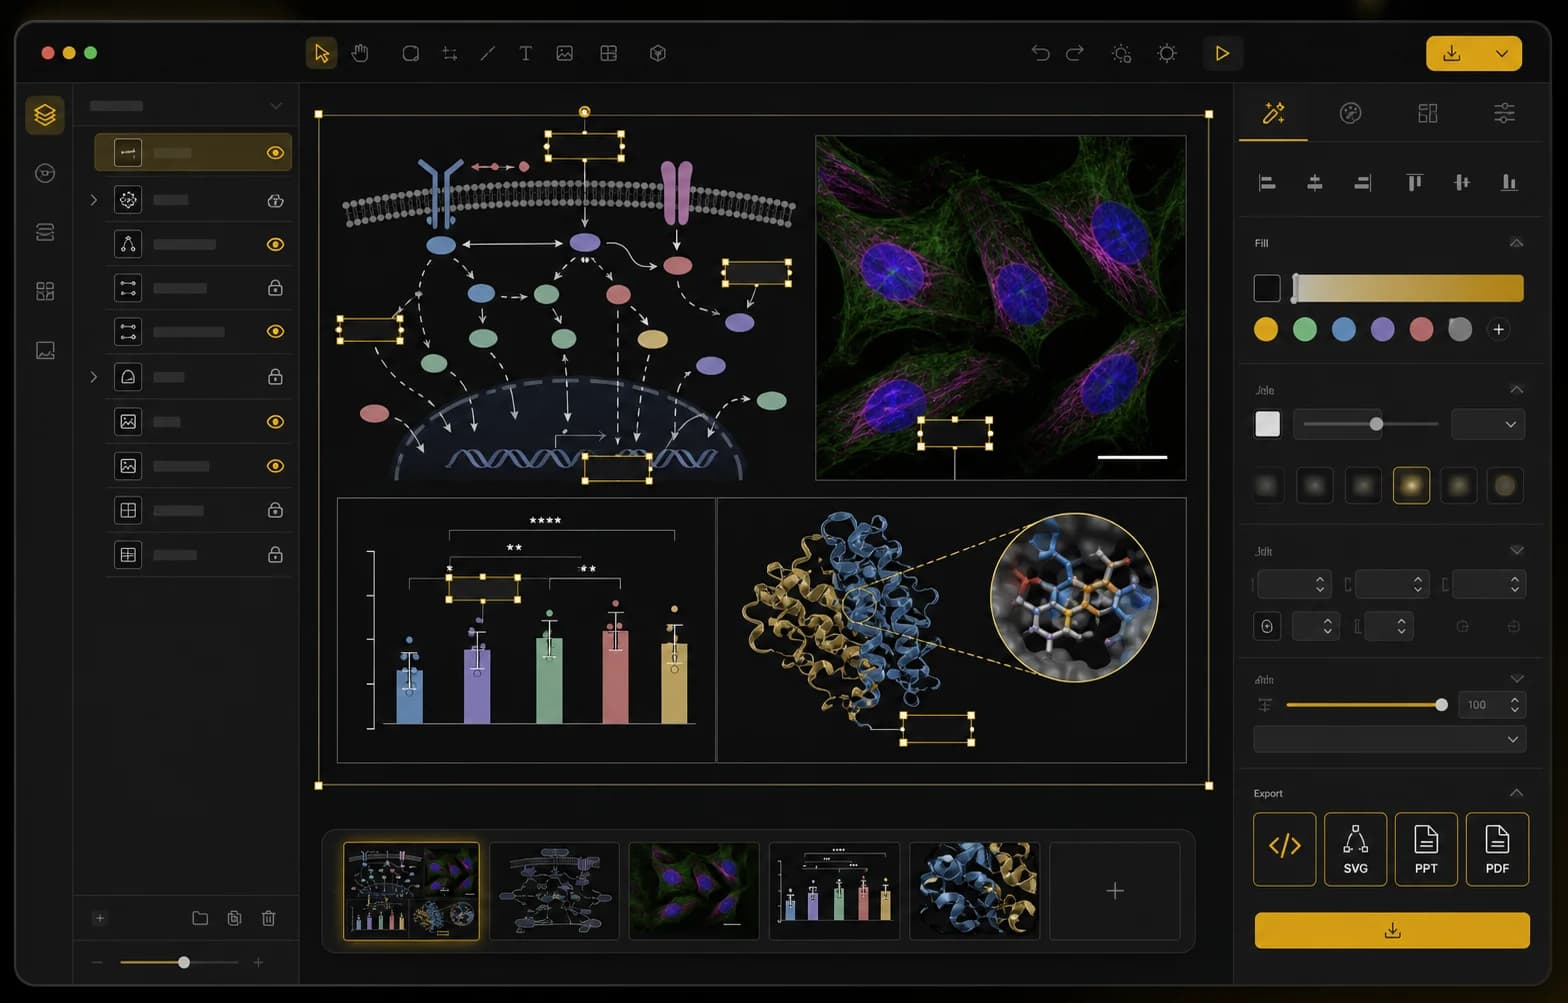
Edit scientific figures with tools for adjusting text, shapes, and layout.
Plan research relationships, visualize neural network architectures, and document study selection or participant flow.

Describe your variables and hypotheses to create a thesis-ready conceptual framework.
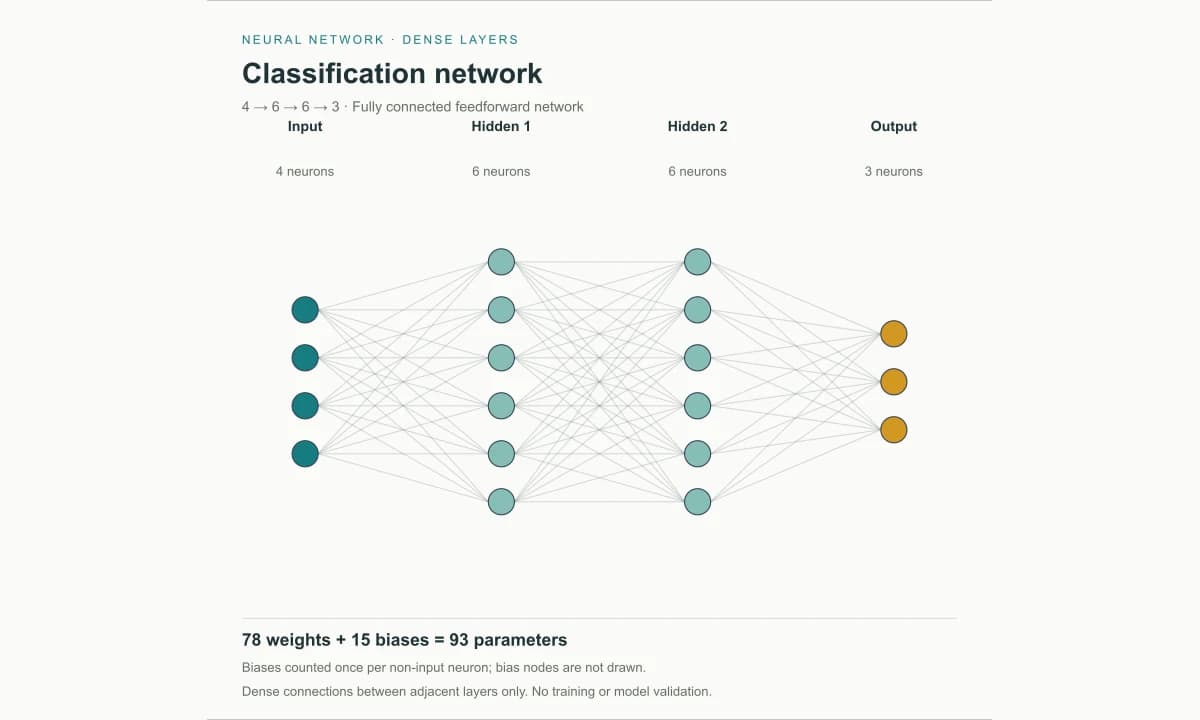
Configure dense network layers, check weights and biases, and export a neural network diagram as SVG or PNG.
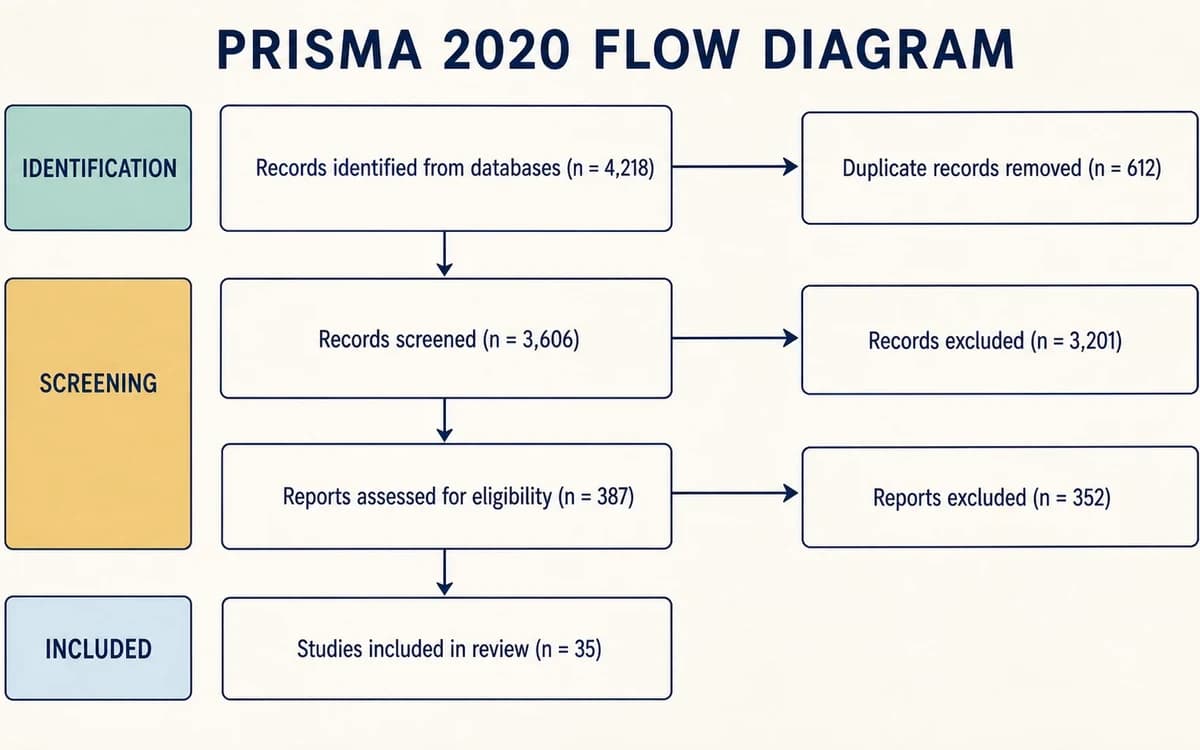
Enter systematic review counts, validate each stage, and export a PRISMA 2020 SVG or PNG.
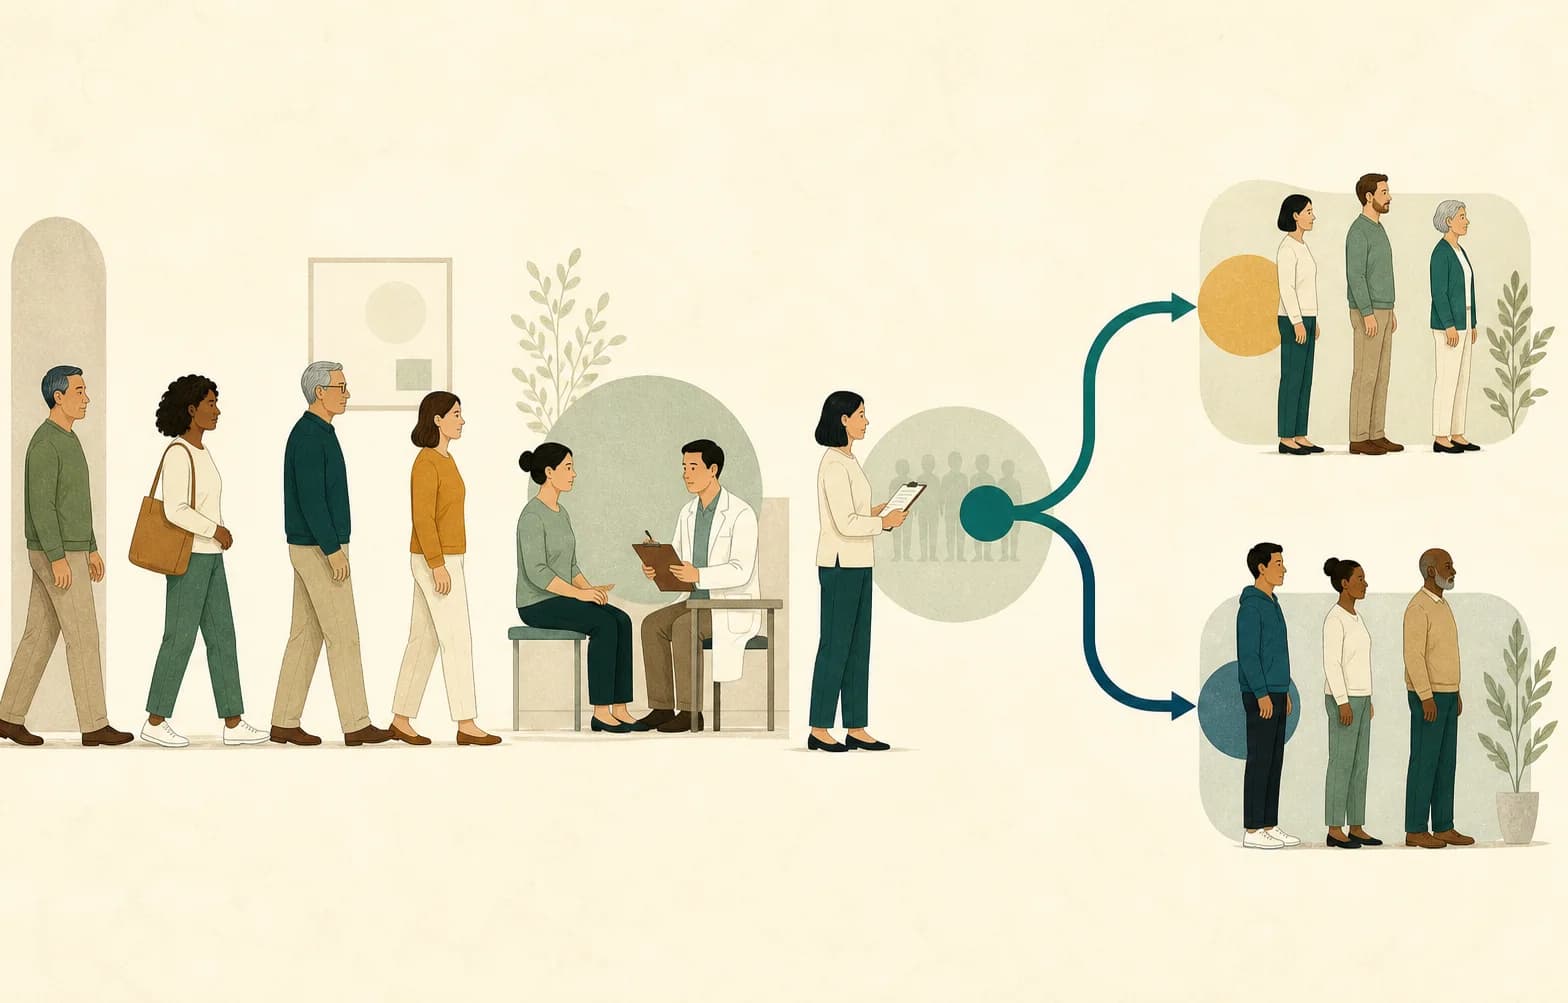
Enter randomized trial counts, validate participant flow, and export a CONSORT 2025 SVG or PNG.
Organize concepts, language, learning, comparisons, and stories with editable diagrams.

Create editable Frayer, KWL, Venn, and cause-and-effect worksheets, then export or print them free.
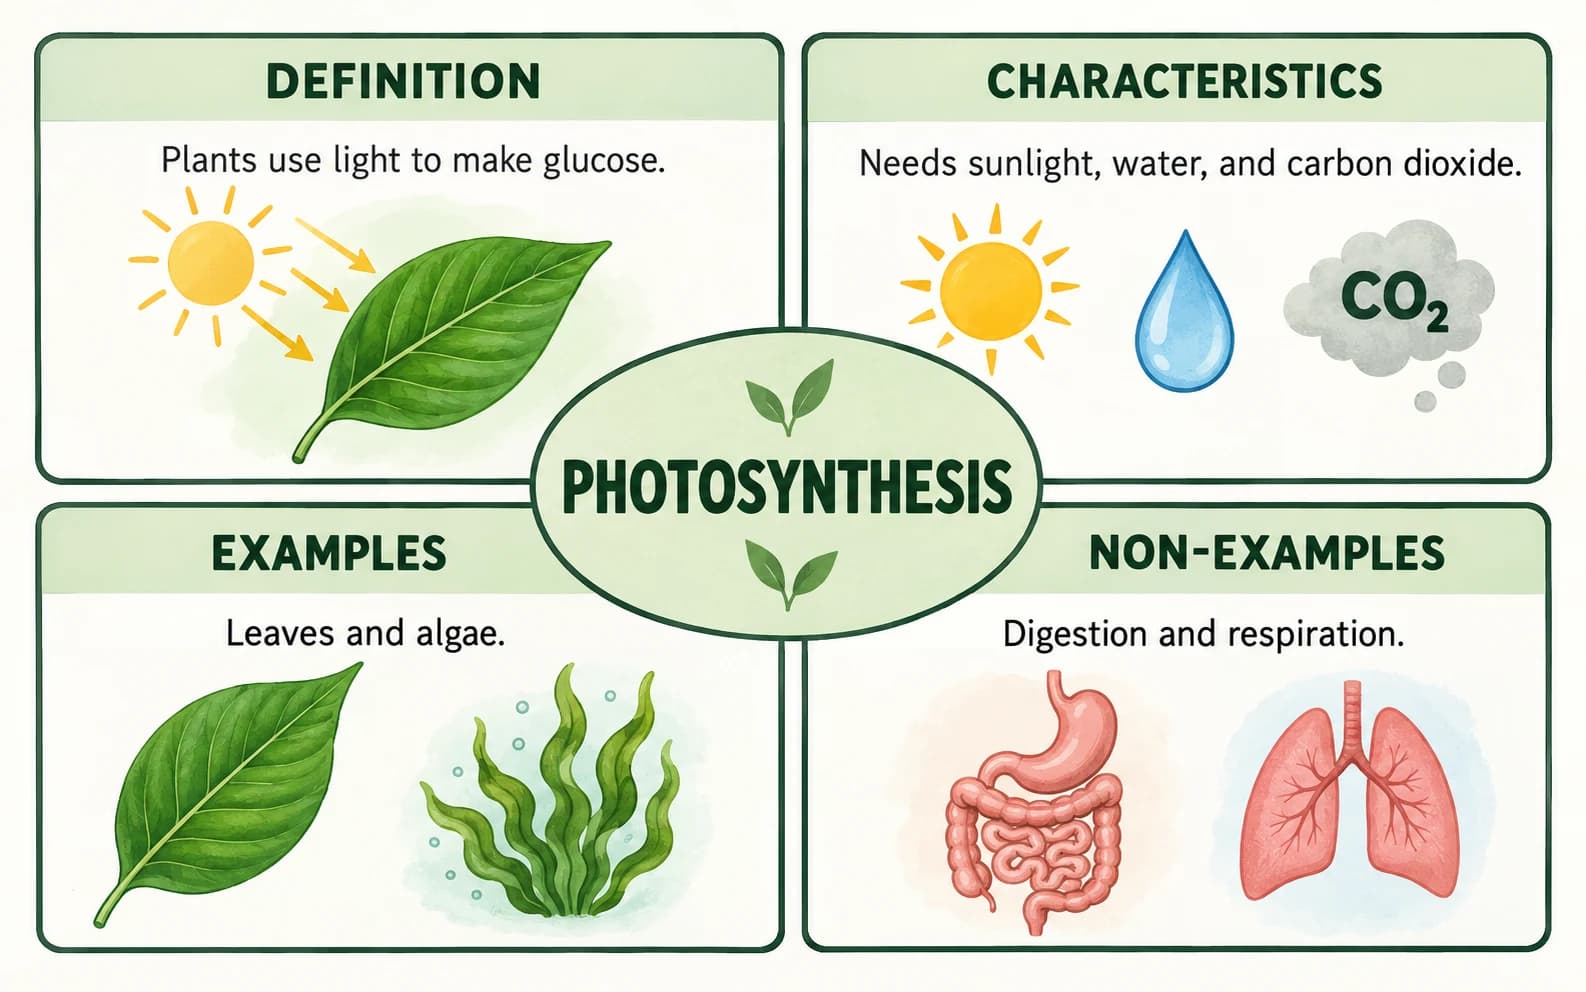
Create a filled vocabulary model or blank printable Frayer worksheet, then export it as SVG, PNG, or PDF without signing up.
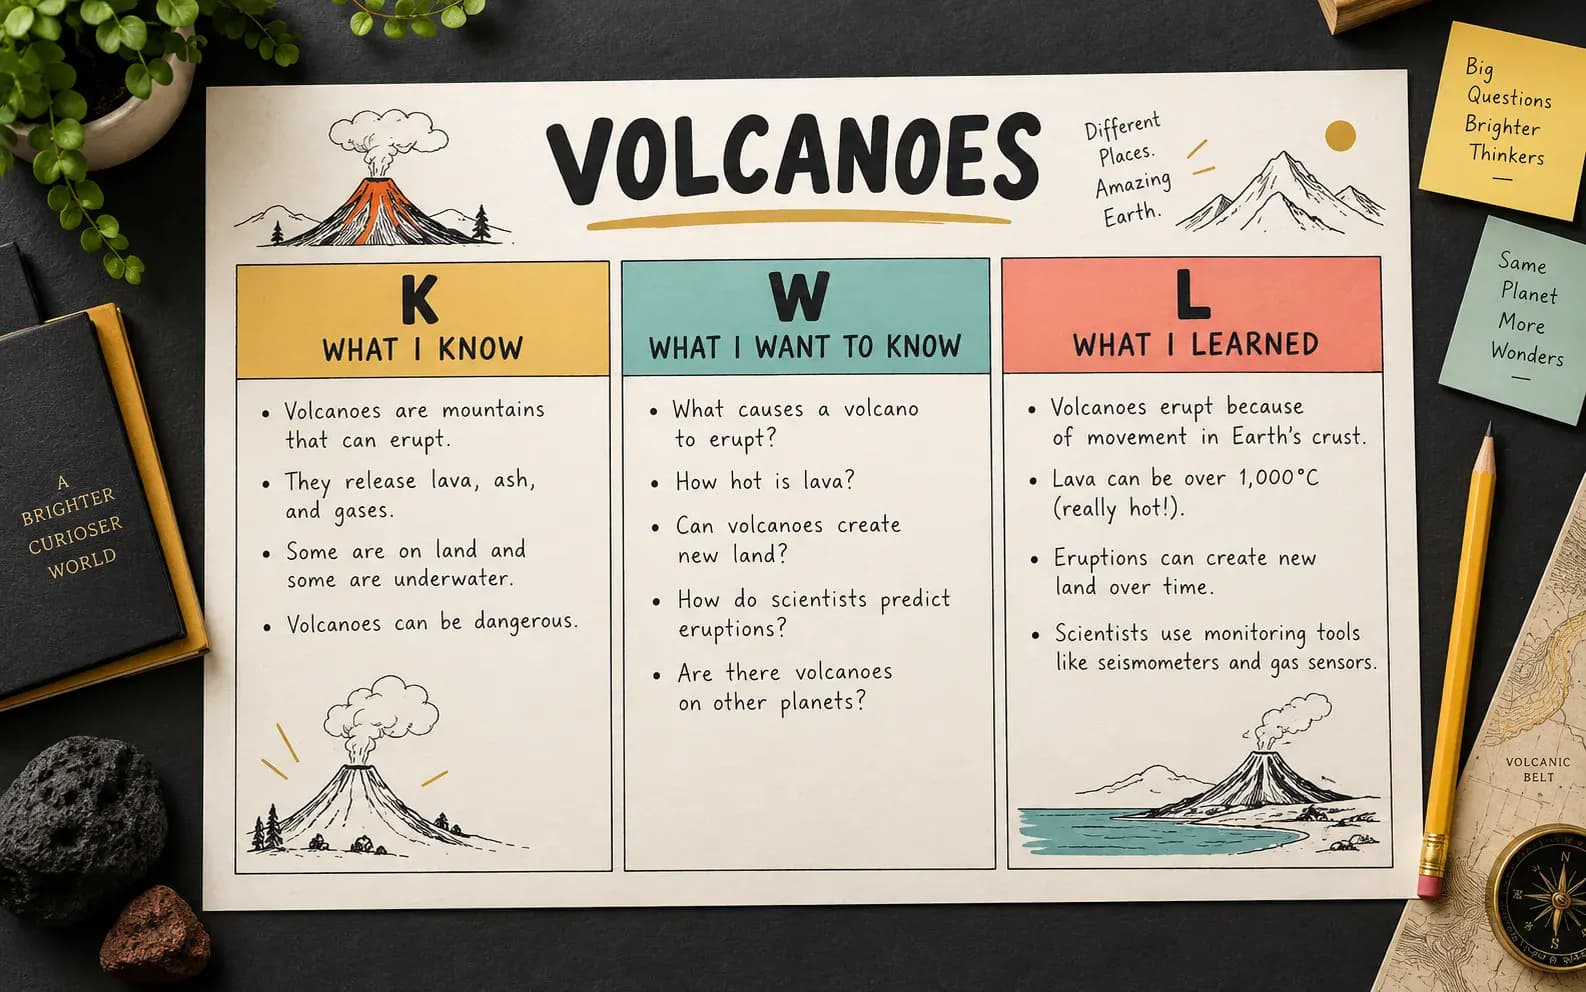
Create editable KWL or KWHL charts, switch between filled and blank worksheets, and export SVG, PNG, or PDF.
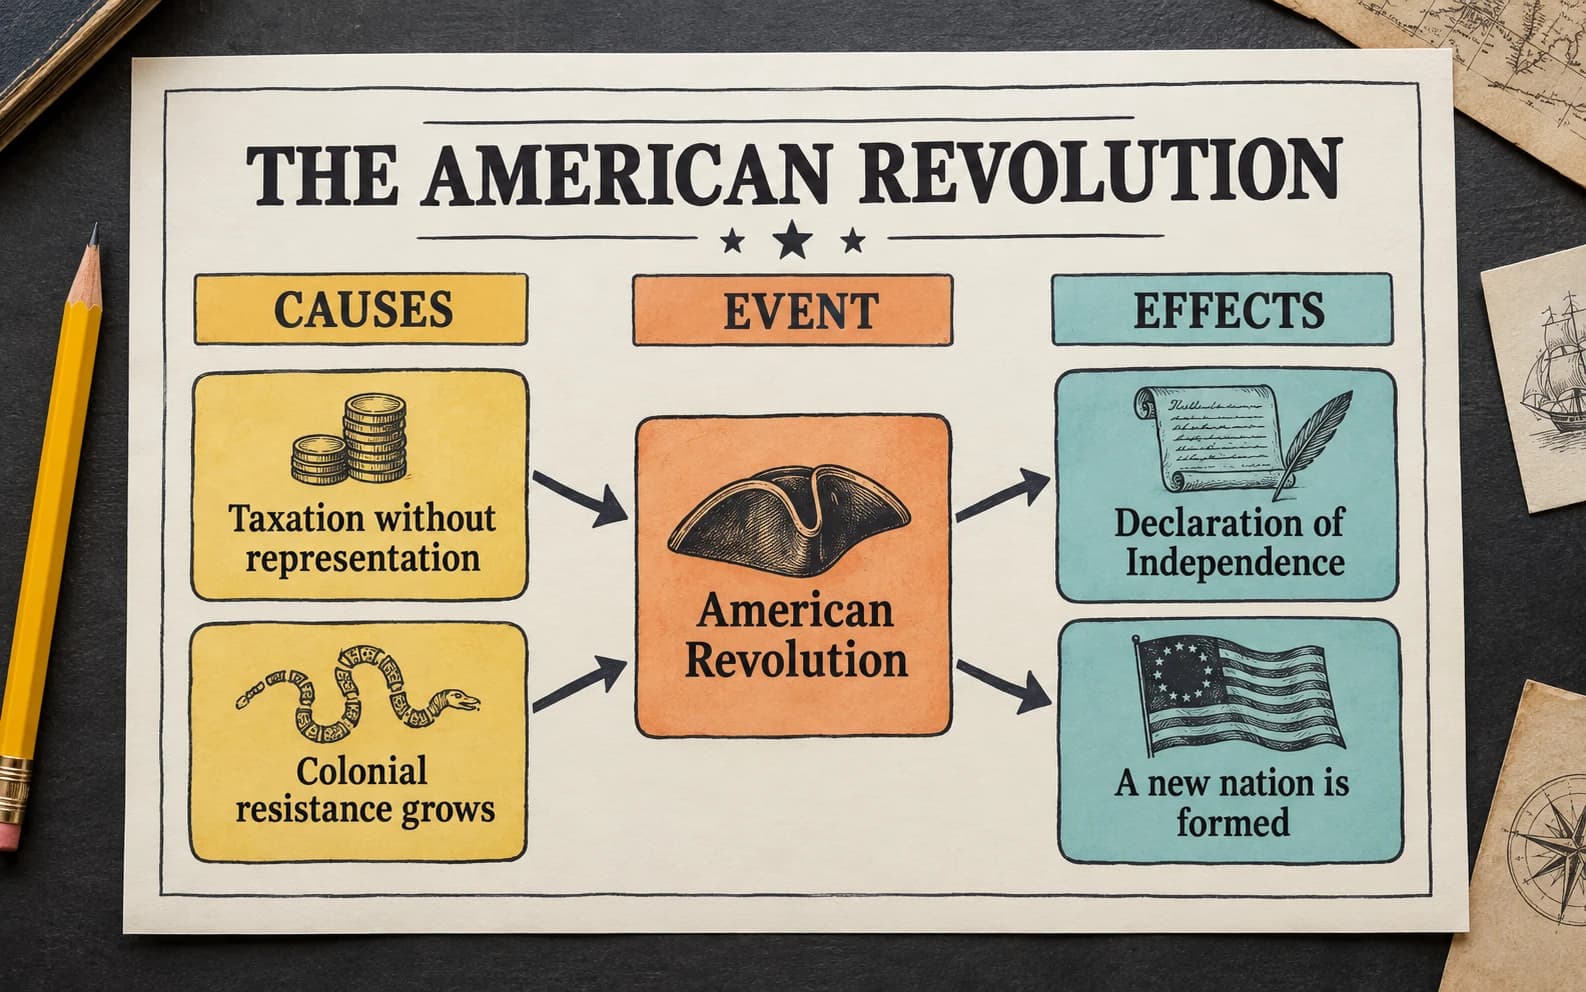
Map multiple causes and effects or build an event chain, then export a filled example or blank printable worksheet.
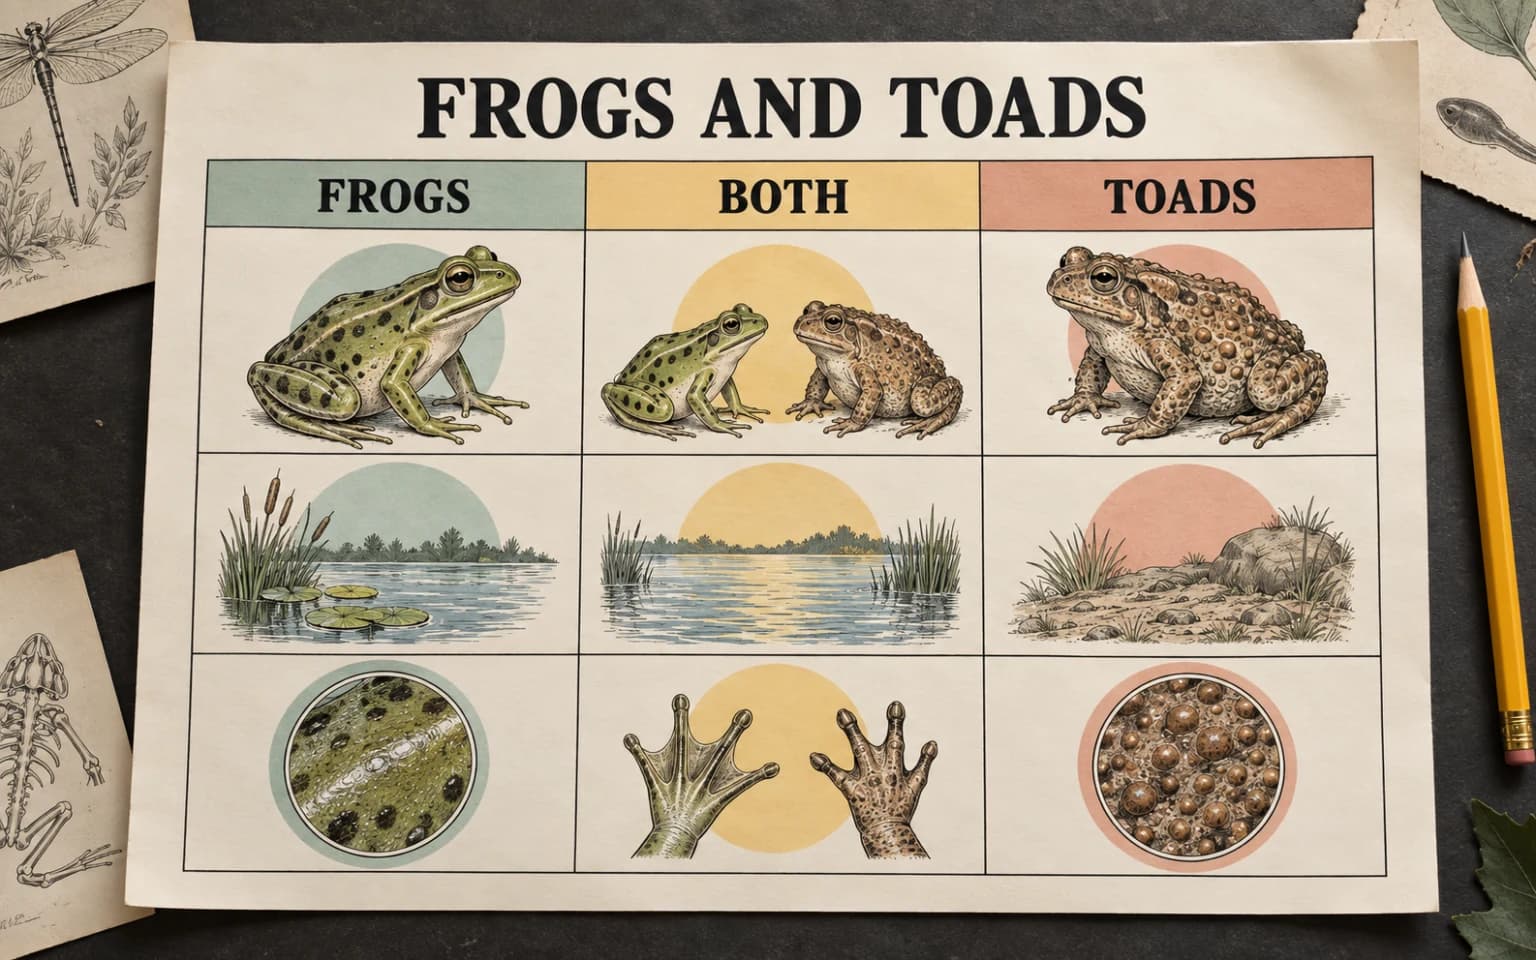
Compare 2–5 subjects by the same categories, then export a filled model or blank printable worksheet.
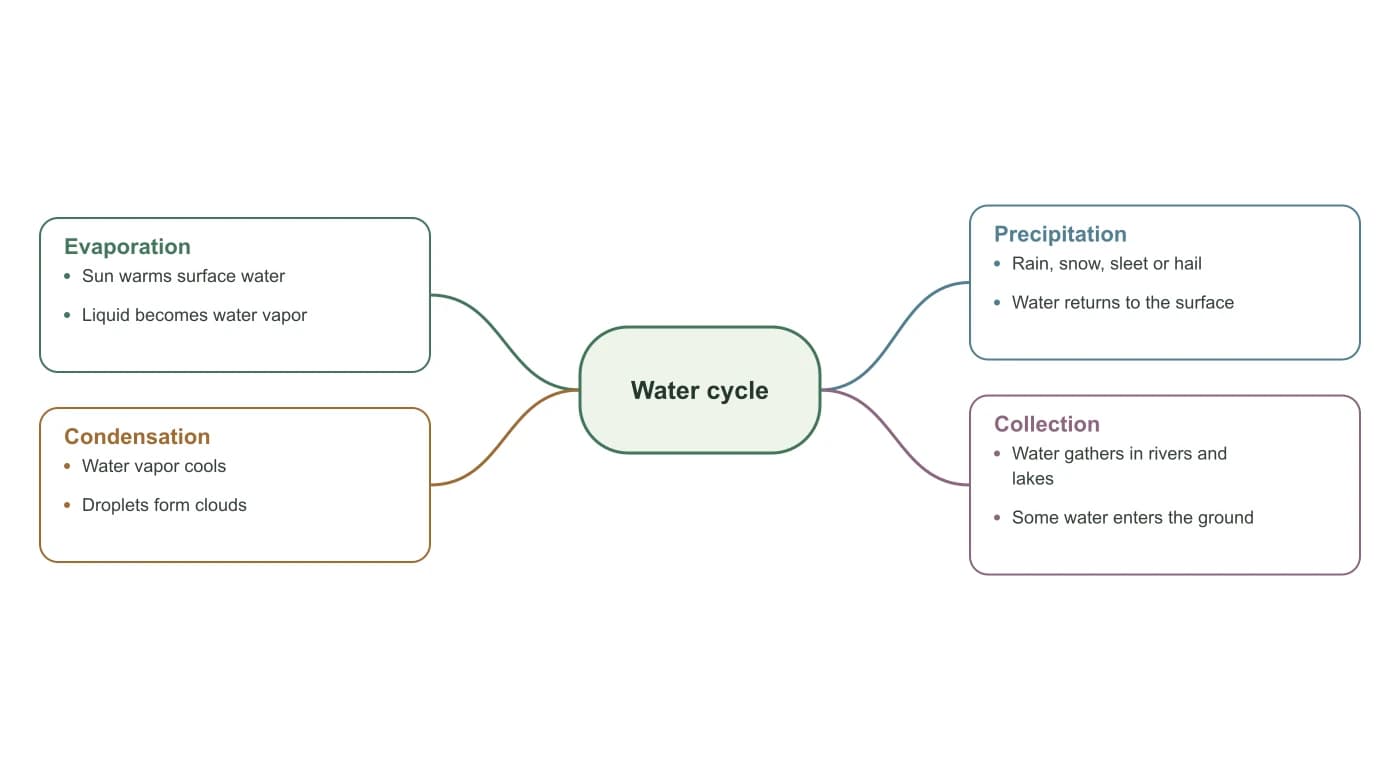
Organize a topic into editable branches for brainstorming, revision and writing.
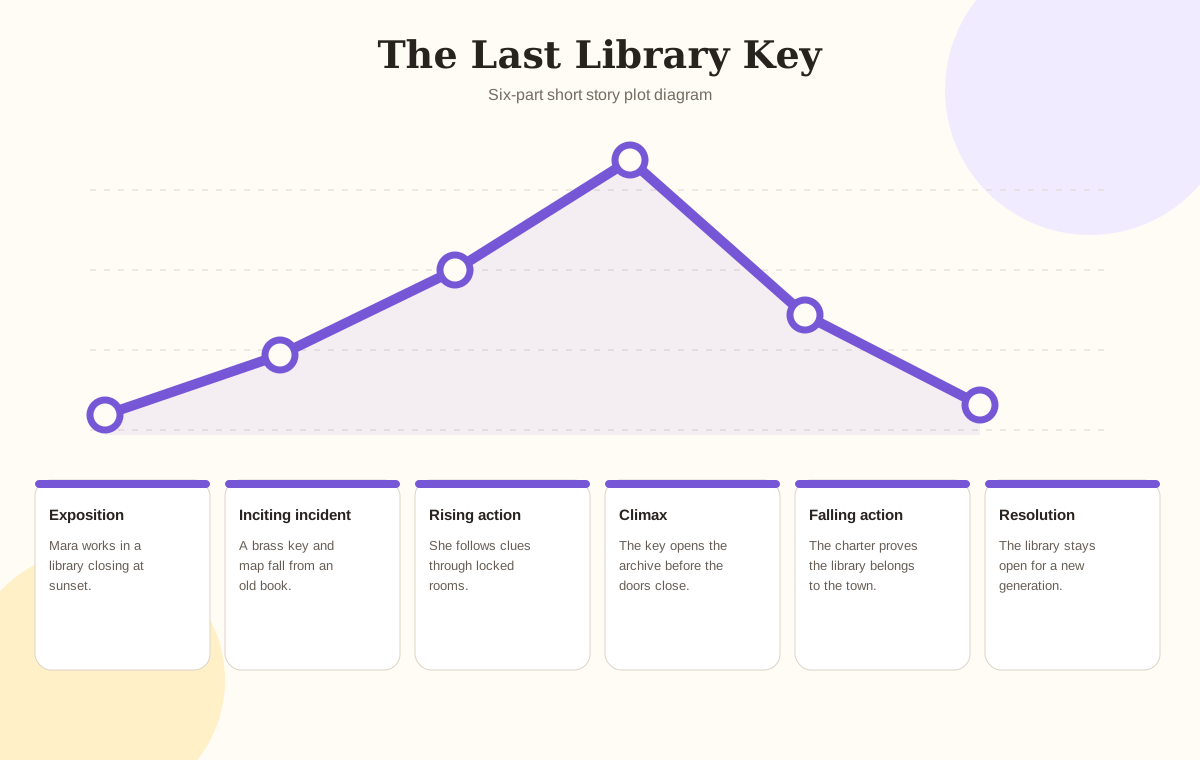
Map story events onto an editable tension curve, then export a finished plot diagram or blank worksheet.
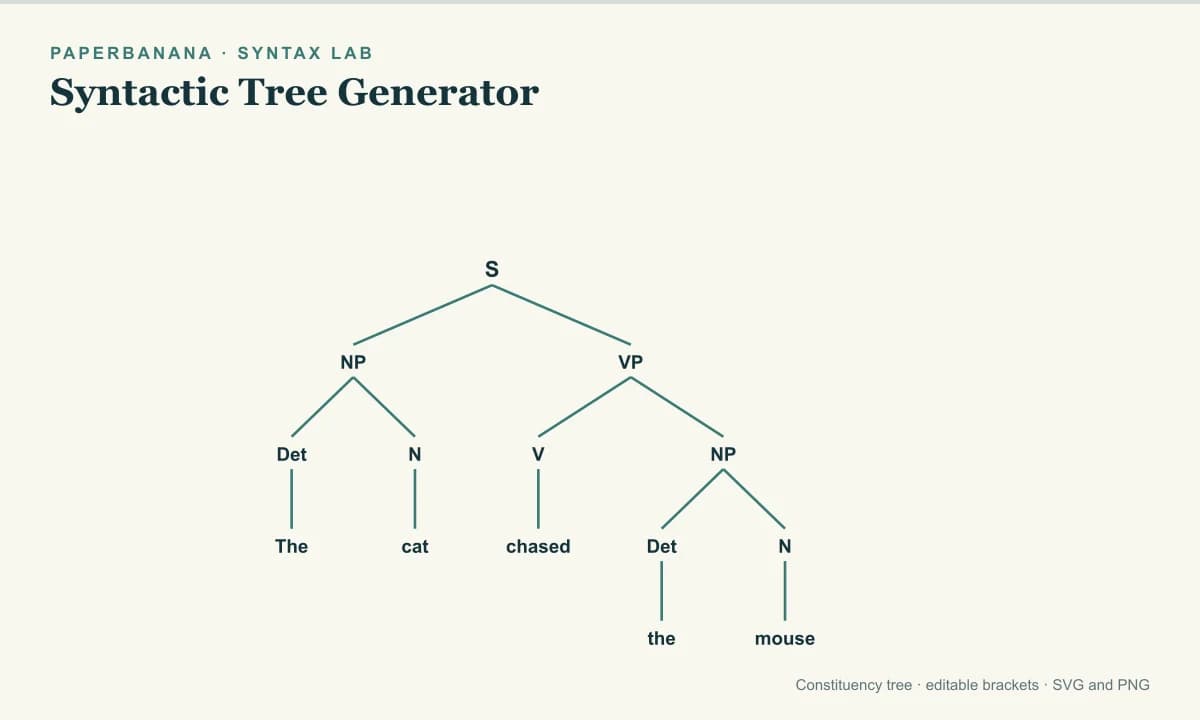
Draft a constituency tree from a short English sentence, edit labeled brackets, and export SVG or PNG.
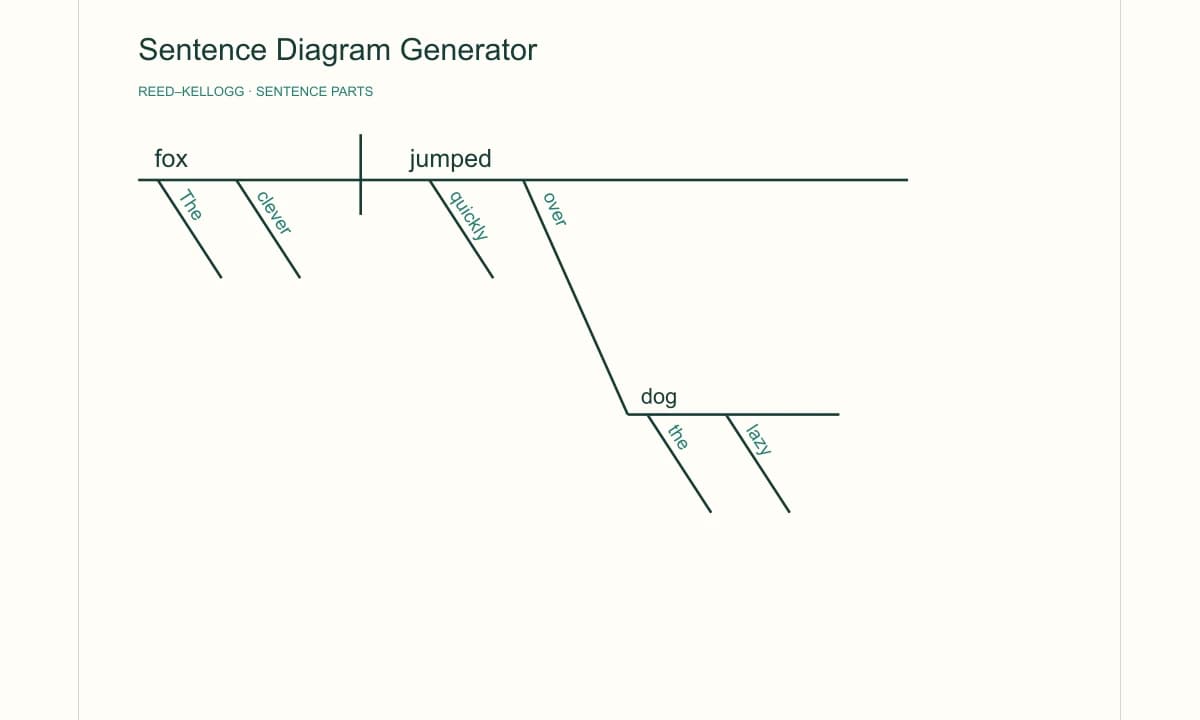
Enter subjects, verbs, objects, and modifiers to build a Reed–Kellogg sentence diagram, check word coverage, and export SVG or PNG.
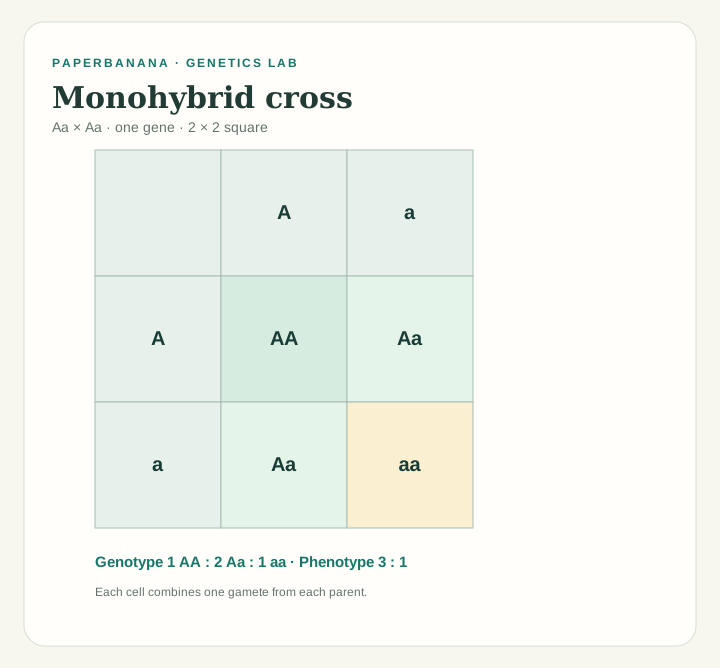
Create 2×2 or 4×4 Punnett squares, check genotype and phenotype ratios, and export genetics worksheets.
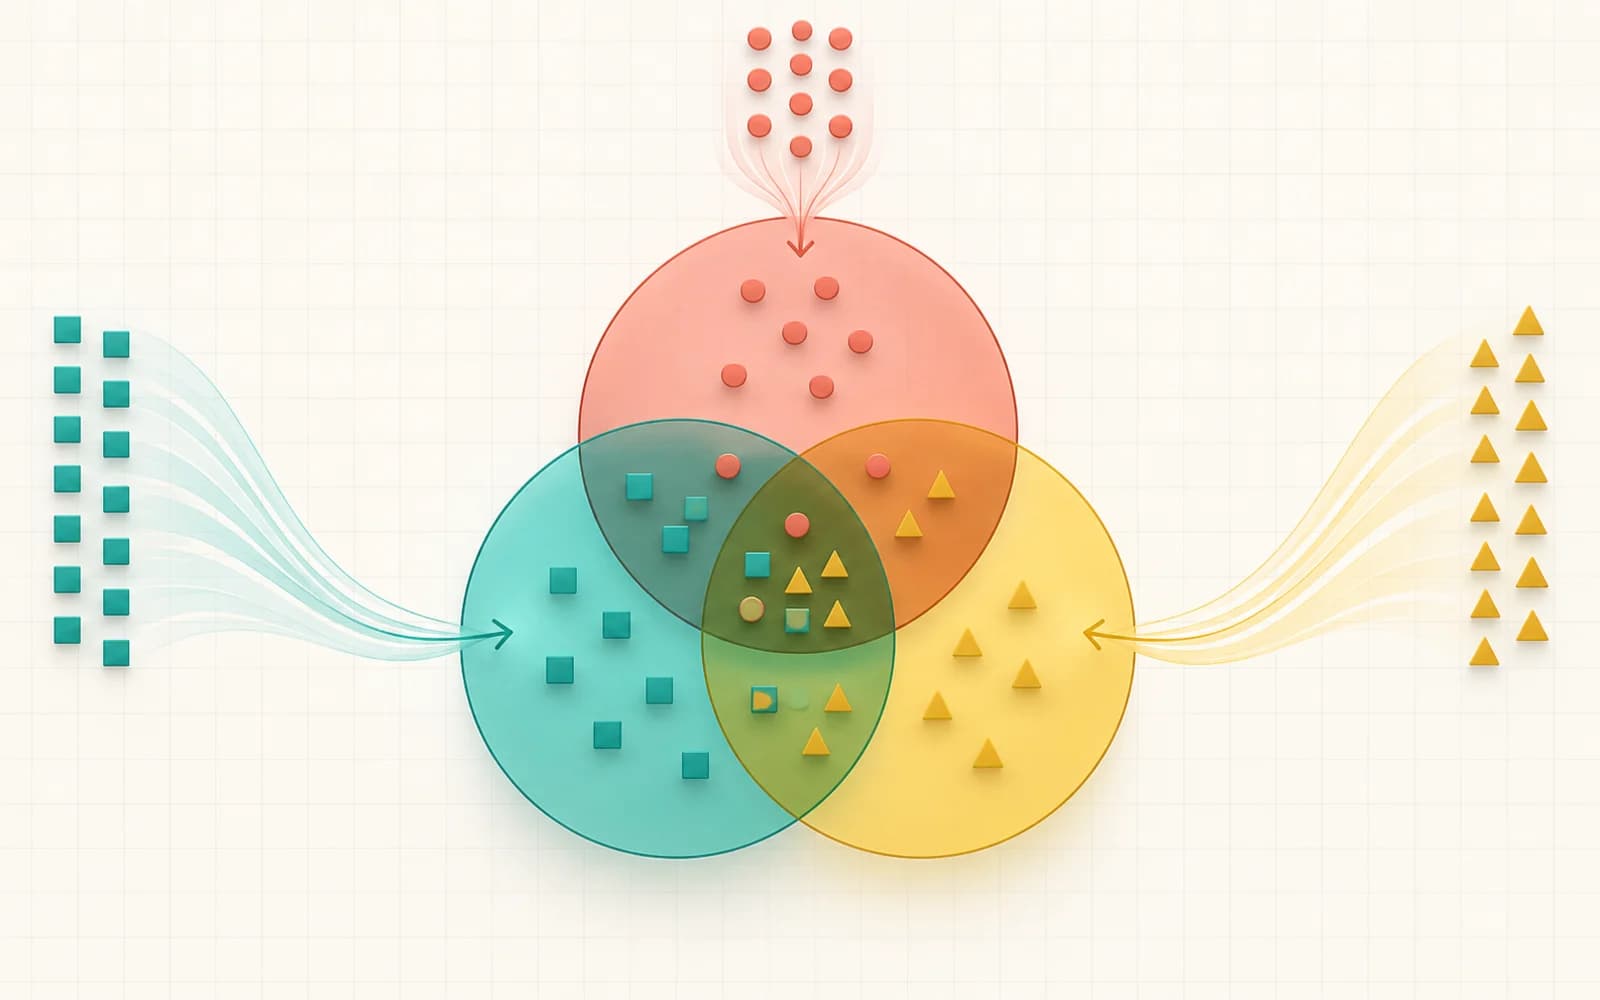
Paste lists or import CSV data, calculate exact overlaps across 2–6 sets, and export SVG or PNG.
Make factor trees, number lines, force diagrams, and Bohr atom models for clear, printable learning materials.
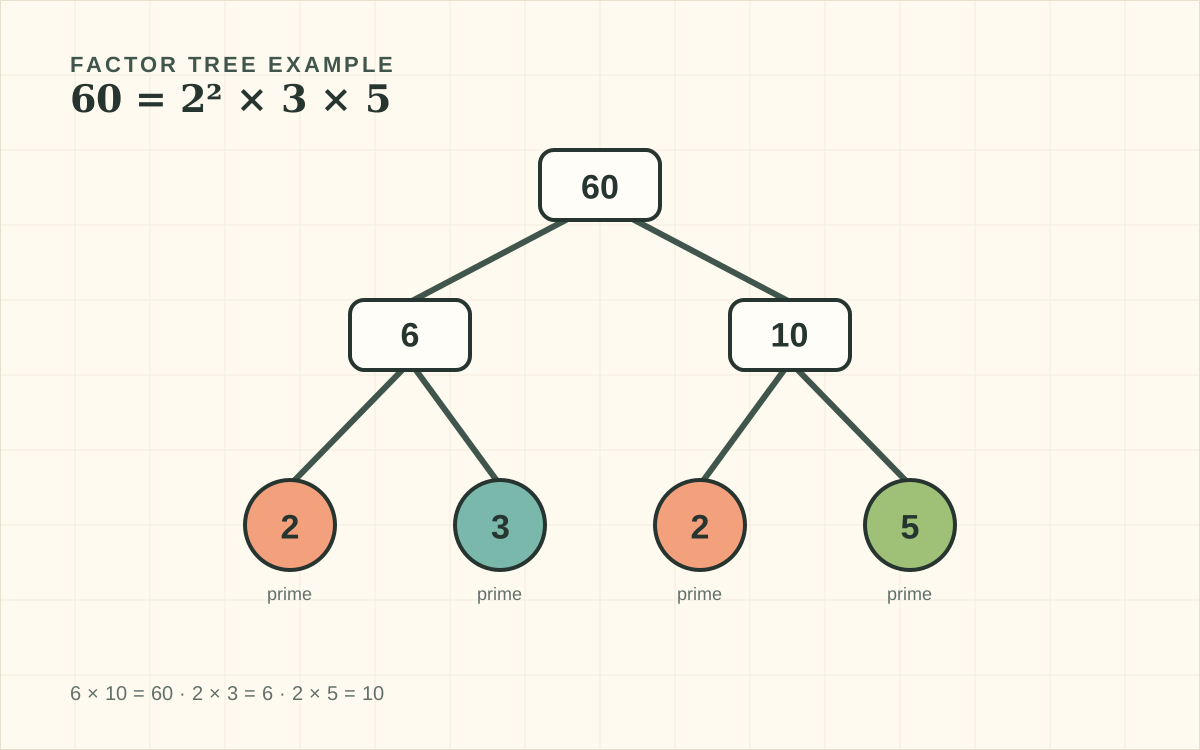
Build a visual factor tree, compare valid factor pairs, and print a prime factorization worksheet.

Set the range and tick interval, plot fractions or inequality intervals, and make a blank worksheet with its answer key. Preview instantly and export without signing up.
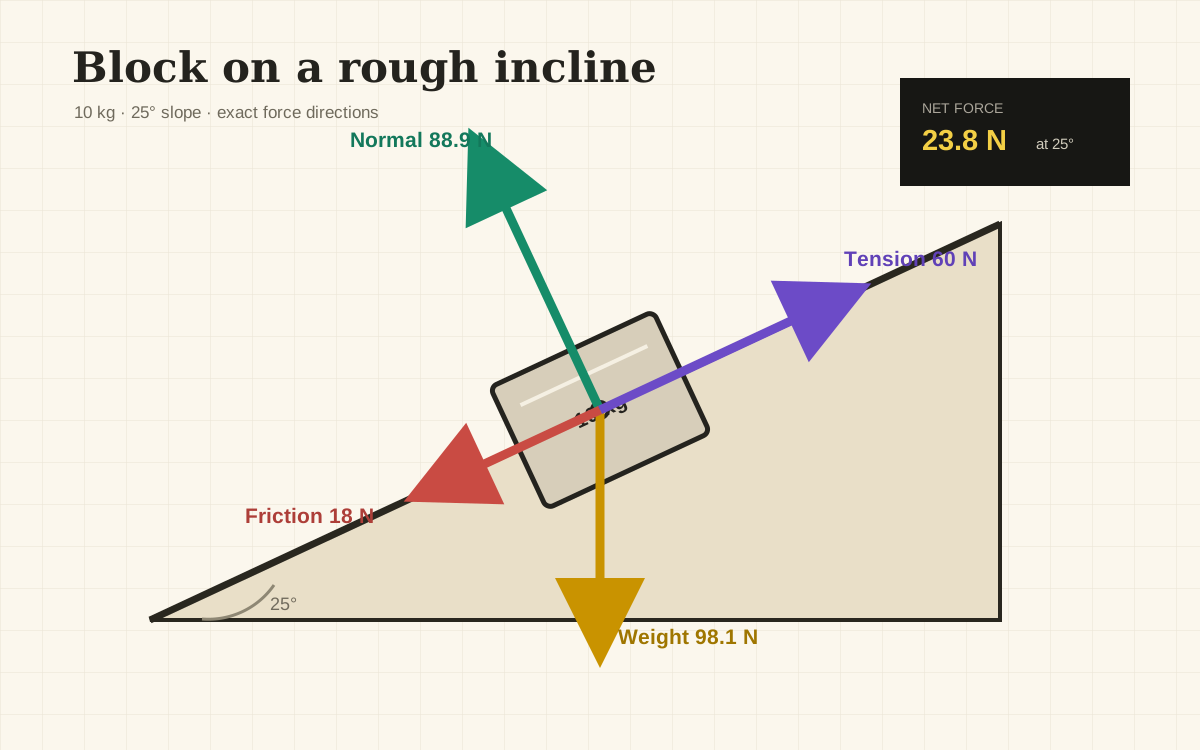
Draw exact force vectors, calculate components and net force, check the setup, and export SVG or PNG.
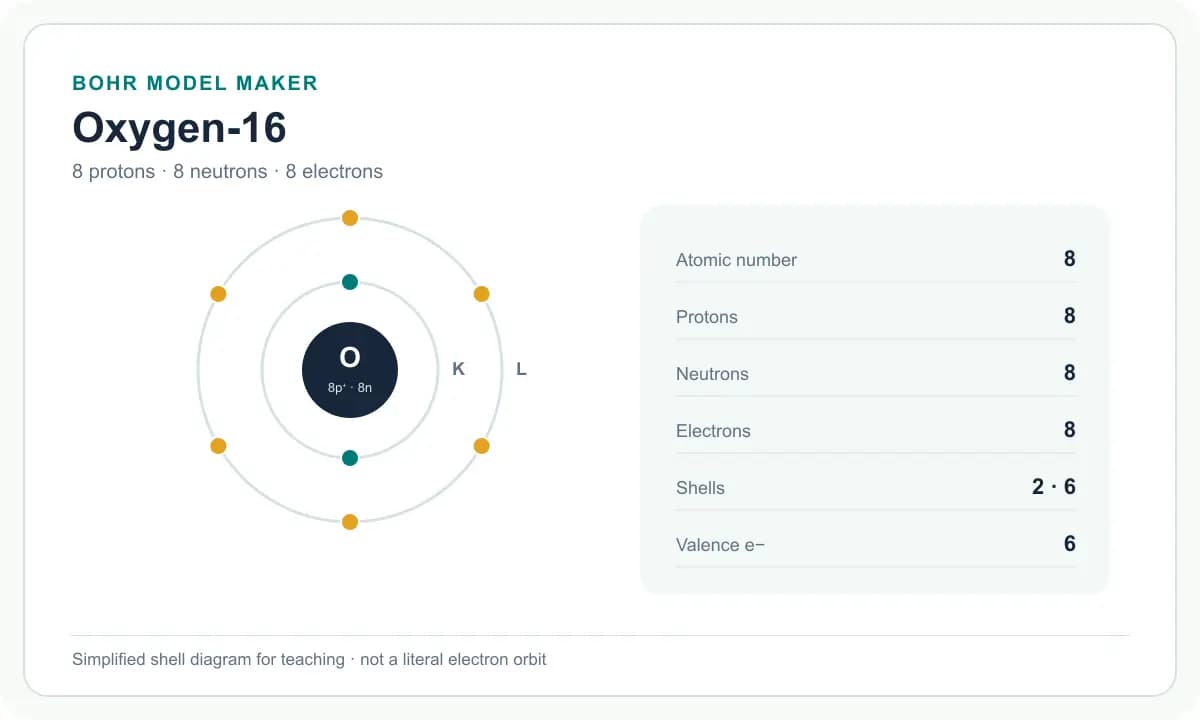
Choose an element, inspect electron shells and particle counts, compare isotopes or ions, and download SVG or PNG.
Turn research data into plots, heatmaps, survival curves, and phylogenetic trees.
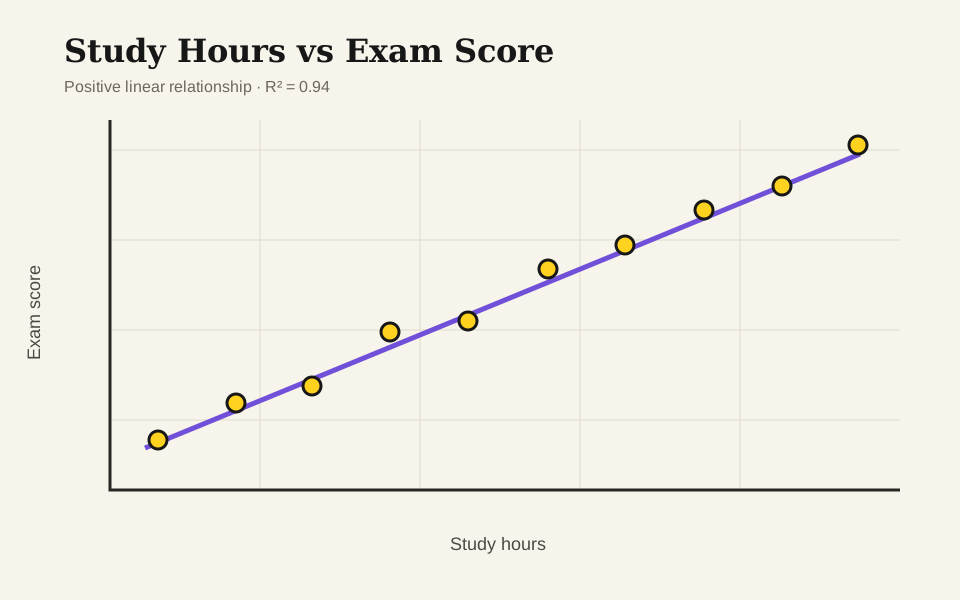
Paste X-Y data, fit a line of best fit, check R² and outlier impact, then export SVG or PNG.
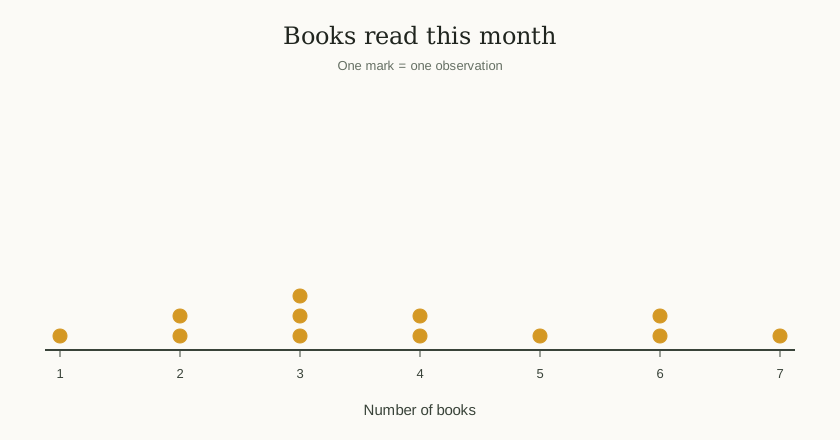
Paste numeric values, stack repeats, and export a dot plot as SVG or PNG.
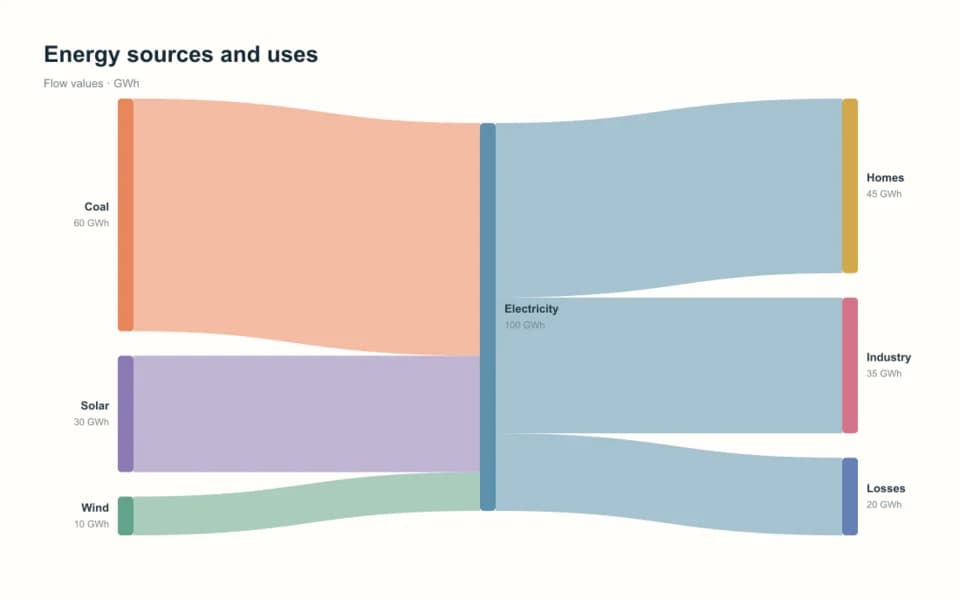
Paste source-target-value data, check flow balance, and export a Sankey diagram as SVG or PNG.
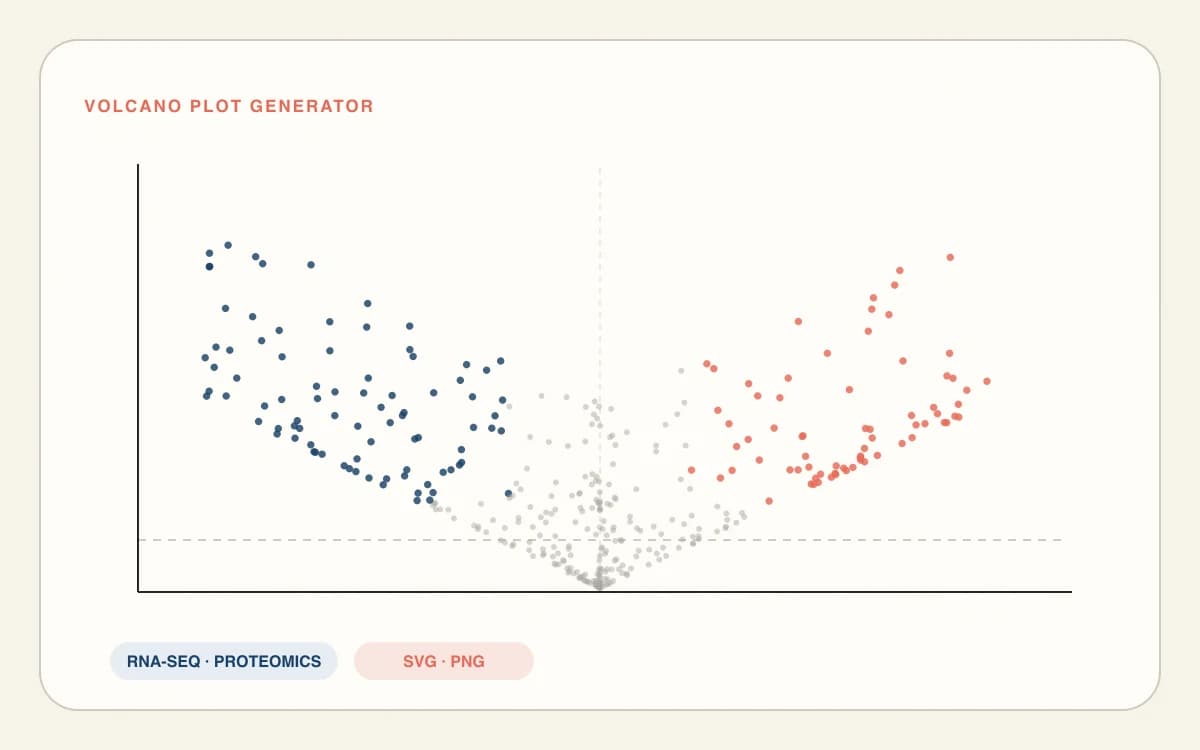
Paste differential-expression data, check the mapped columns, adjust thresholds, and export SVG or PNG.
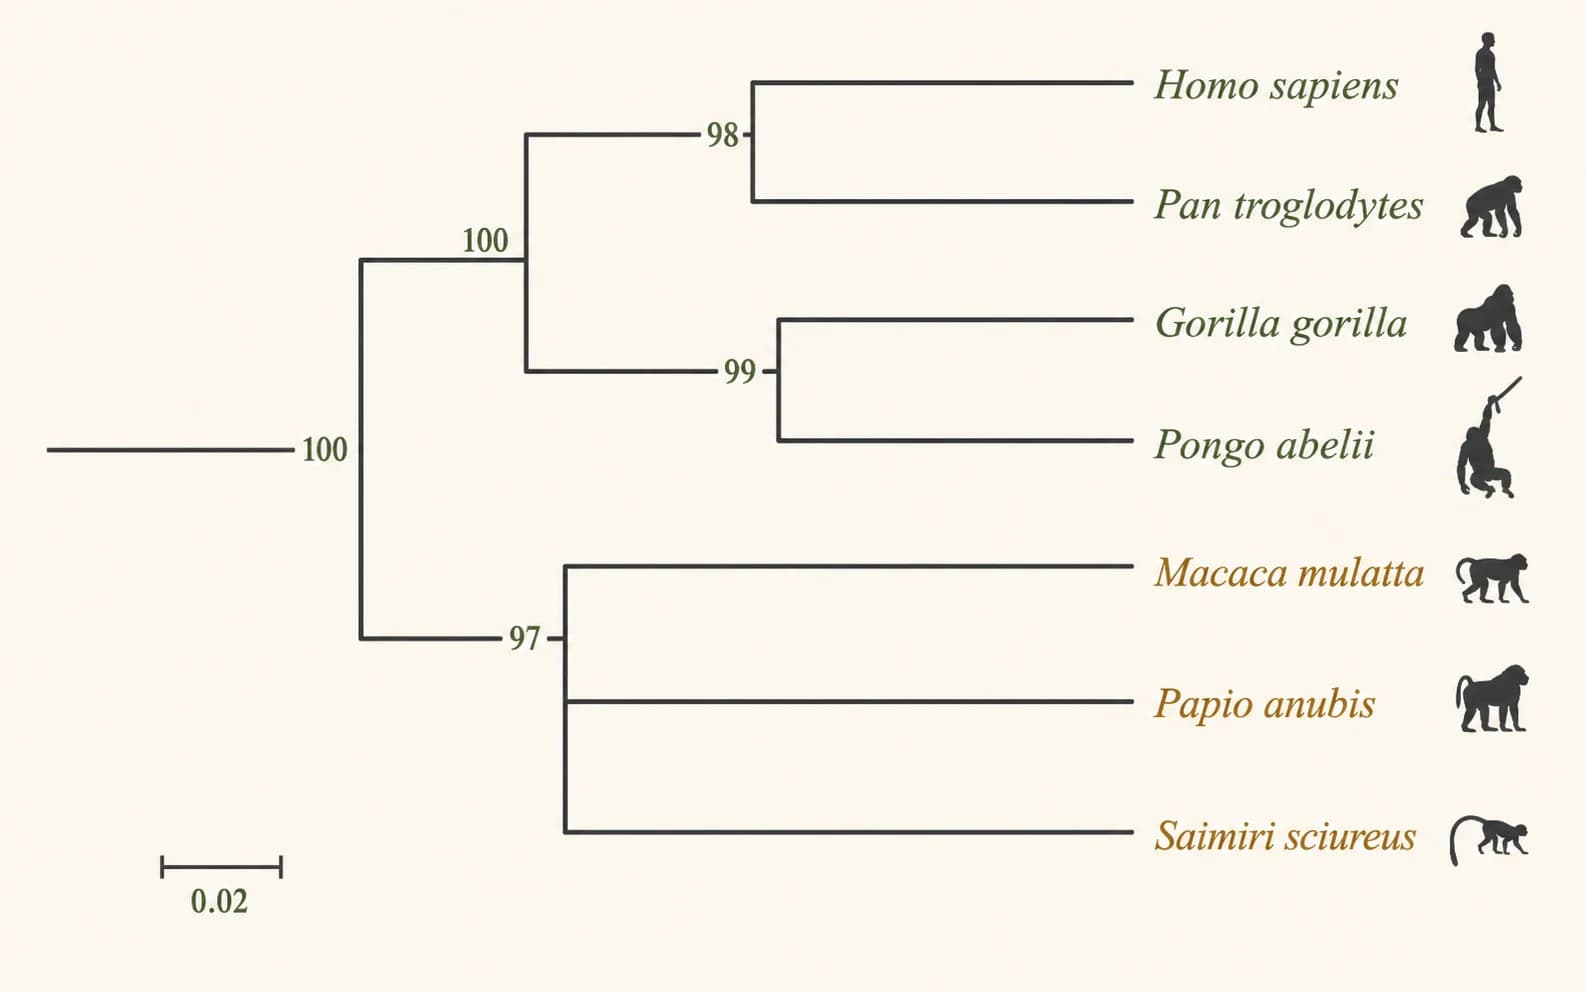
Paste Newick, a species list, or aligned FASTA to generate and export an editable phylogenetic tree.
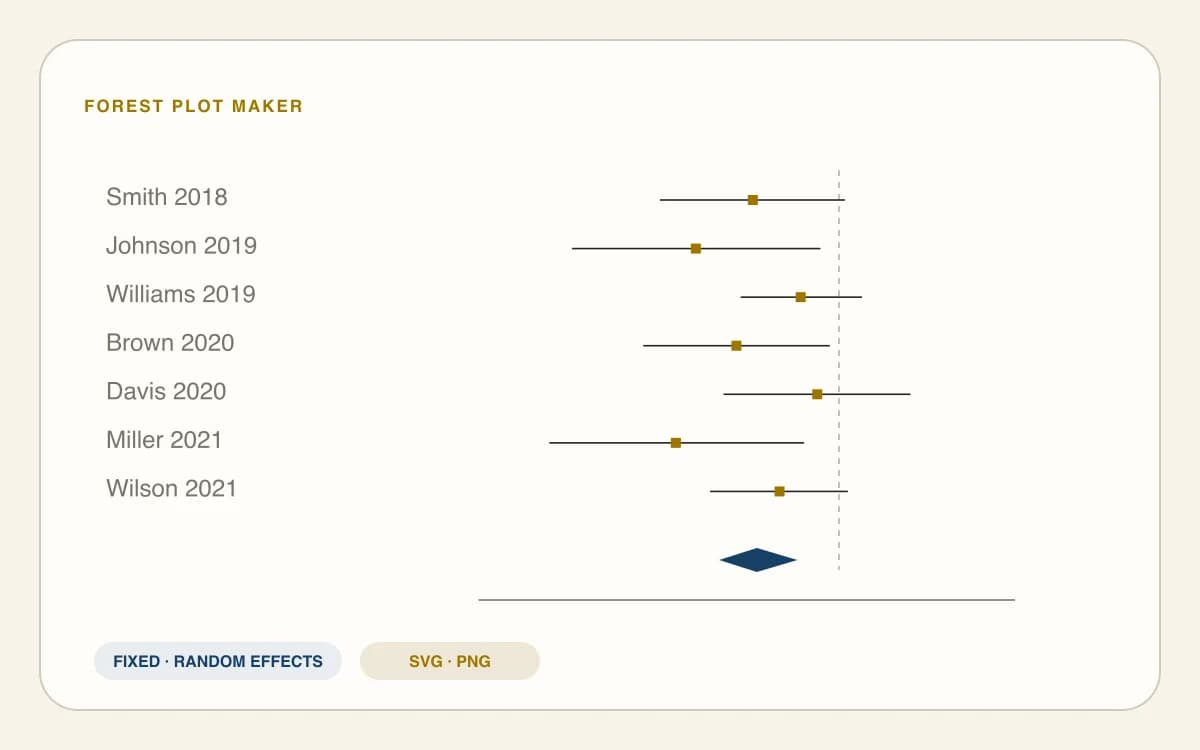
Paste study effects and confidence intervals, compare fixed or random effects, and export SVG or PNG.
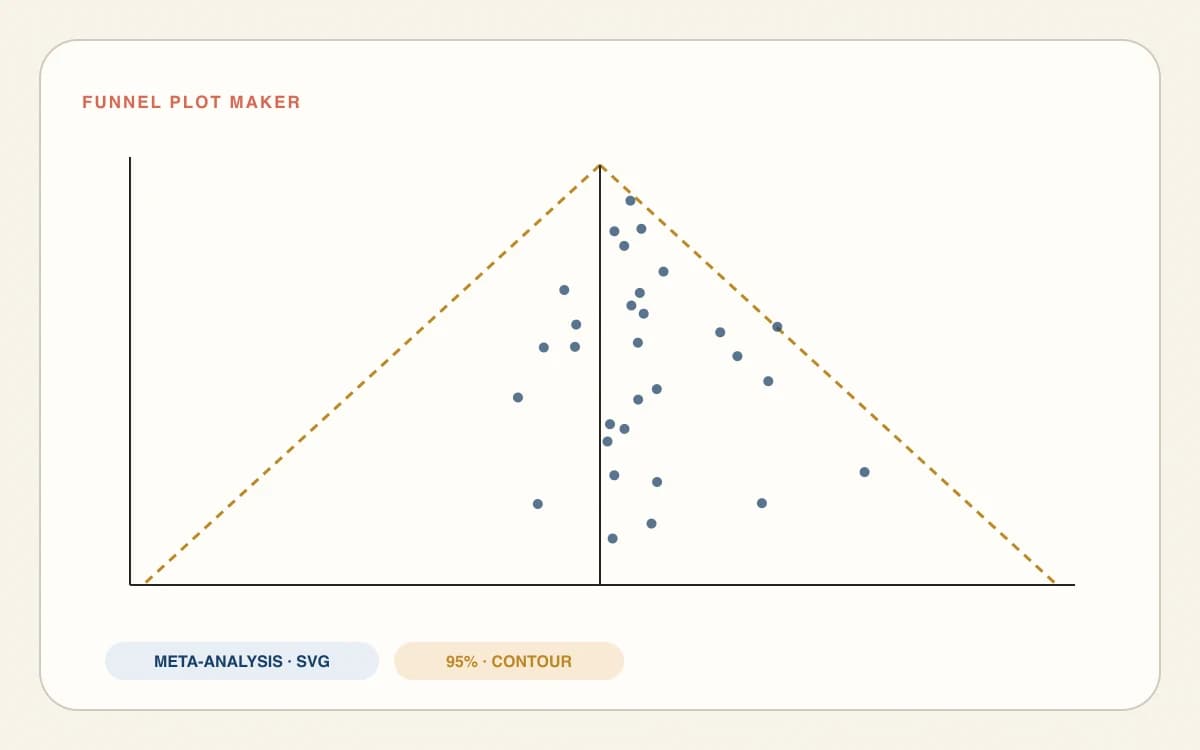
Paste study effects and precision data, assess asymmetry, and export SVG, PNG, or JSON.
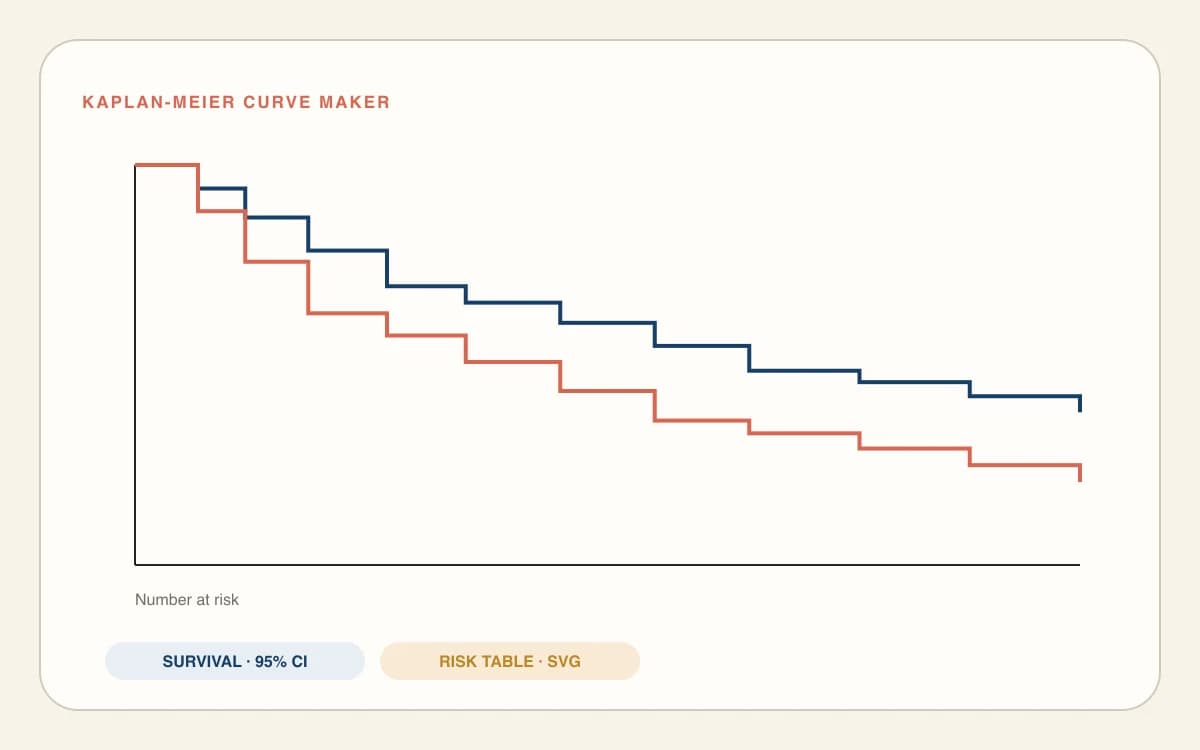
Paste time-to-event data, confirm censoring, add a risk table and log-rank test, and export SVG or PNG.
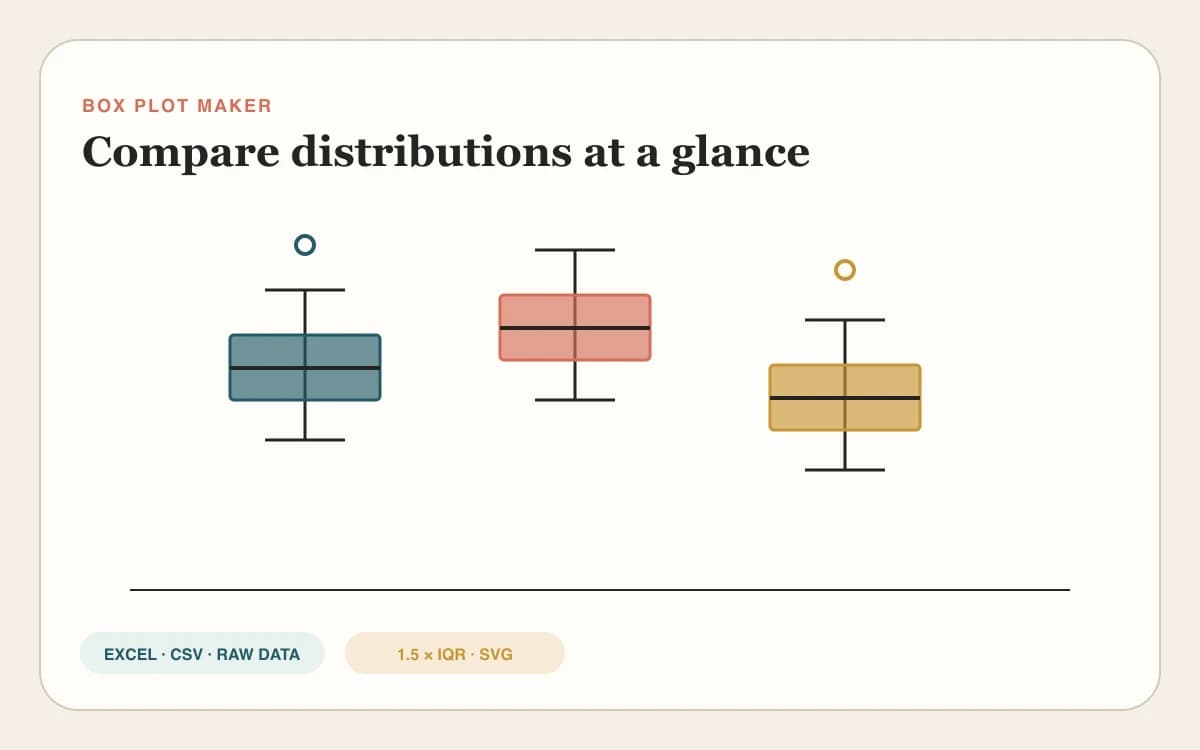
Paste raw values from Excel or CSV, compare groups, detect 1.5×IQR outliers, and export SVG, PNG, or summary CSV.

Paste an Excel or CSV matrix, normalize and cluster rows or columns, add dendrograms, and export SVG, PNG, or ordered CSV.
Check figure requirements and convert image files for your submission workflow.
Can’t find the figure tool you need?
Request a tool