• ロゴ
    PaperBananaAI学術イラストジェネレーター
ホーム
  • ホーム
  • スタジオ
  • 科学イラスト
  • ポスターメーカー
  • ダイアグラムメーカー
  • 図版エディター
  • 料金
マイ作品
  • マイ作品
  • 友達を招待
ロゴPaperBanana
ホーム料金友達を招待
ロゴPaperBanana

PaperBanana - AI学術イラストジェネレーター

support@paperbanana.me

AIツール

  • すべてのツール
  • テキストからイラスト
  • 科学イラスト
  • 図版エディター
  • ダイアグラムメーカー
  • ポスターメーカー

サポート

  • 会社概要
  • 料金
  • お問い合わせ

法的情報

  • プライバシーポリシー
  • 利用規約
  • 許容される利用

© 2026 PaperBanana. All rights reserved.

料金お問い合わせ
AI graphical abstract tool for researchers

Graphical Abstract Maker for Research Papers

Use this Graphical Abstract Maker to turn a research abstract into a reviewable visual story, then refine labels, arrows, layout, and scientific details before export.

Images + concise research textEditable labels, arrows, and detailsJournal requirement guidanceReference-guided generation
Select Model
0

Start from an example

Resolution
Graphical abstract patterns

Select an example to reuse its structure and prompt

Graphical abstract basics

What is a graphical abstract?

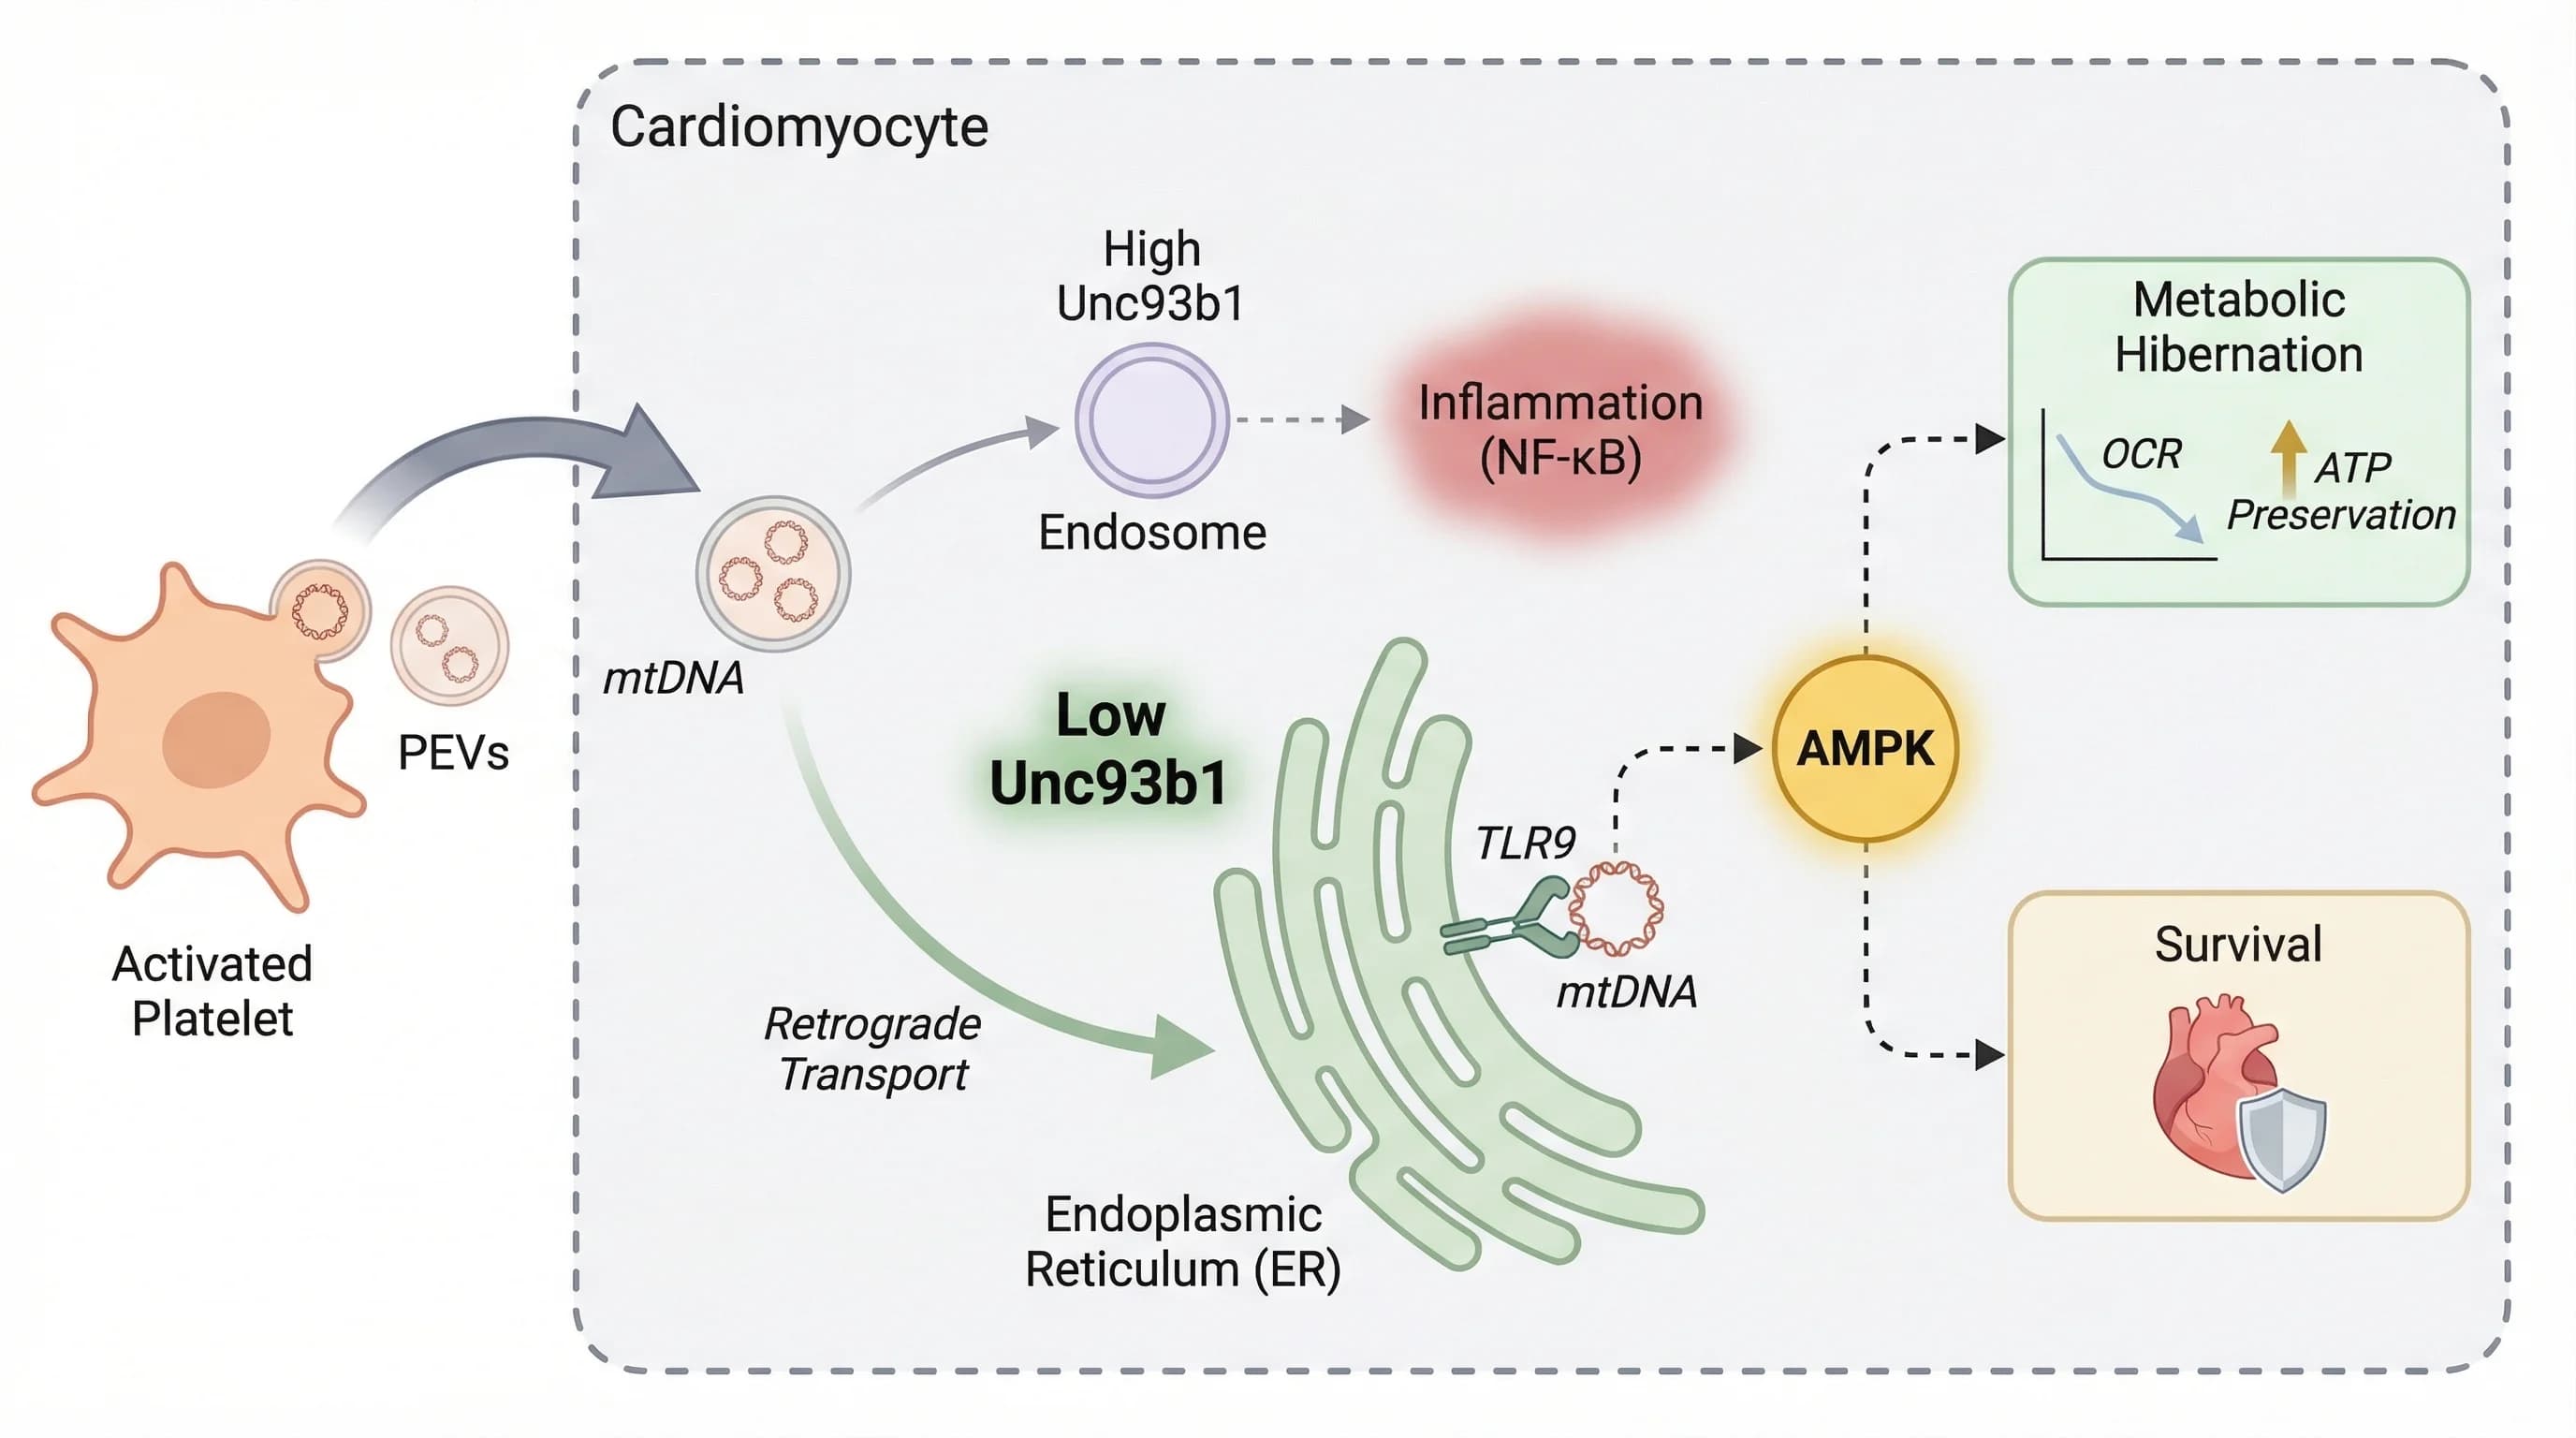
A graphical abstract is a single visual summary of a research paper. It combines scientific illustrations, concise labels, and a clear reading path to show the research question, method or mechanism, key result, and main conclusion at a glance.

It is not simply a decorative image, and it is not a full research poster. A useful graphical abstract compresses the paper-level story into one connected figure, helping readers understand what was studied, what happened, and why the result matters before they read the full text.

An AI graphical abstract maker can turn an abstract or structured study summary into a first visual draft. Researchers should still verify every label, relationship, numerical claim, and journal requirement, then refine the layout before export or submission.

01

Research question

The problem, context, or hypothesis the paper addresses.

02

Method or mechanism

What the researchers did or how the process works.

03

Key result

The central supported finding without invented evidence.

04

Main conclusion

The takeaway that follows directly from the study.

Submission planning

Graphical abstract requirements by publisher and journal

Graphical abstract policies are not universal. Some publishers provide a shared technical specification, while individual journals and article types decide whether the file is required, optional, or not collected separately.

Official guidance checked: August 2026

Publisher or journalCurrent statusVerified technical guidanceOfficial source

Publisher or journal

Cell Press

Current status

Dedicated guide; requirement varies by journal

Verified technical guidance

Single panel; 5.5 in square at 300 dpi; Arial 12–16 pt; TIFF, PDF, or JPG.

Official source

Cell Press graphical abstract guide

Publisher or journal

Elsevier journals

Current status

Journal- and article-type specific

Verified technical guidance

When requested: minimum 1328 × 531 px at 300 dpi; preserve the wide ratio; TIFF, EPS, PDF, or MS Office.

Official source

Elsevier graphical abstract guidance

Publisher or journal

PLOS Biology

Current status

No separate graphical abstract requirement listed

Verified technical guidance

General figure rules: 789–2250 px wide at 300 dpi, maximum 2625 px high, 300–600 dpi, TIFF or EPS.

Official source

PLOS Biology figure requirements

Publisher or journal

Nature Methods

Current status

Not listed as a standard content item

Verified technical guidance

Requirements depend on the article type and post-acceptance instructions; confirm any visual-summary request with the journal.

Official source

Nature Methods content types

Publisher or journal

eLife

Current status

Not listed in the current submission overview

Verified technical guidance

The current workflow centers on Reviewed Preprints; confirm any optional visual-summary asset directly with eLife.

Official source

eLife submission overview

Policies and article-type requirements can change. Treat this table as a planning reference, recheck the live guide for your target journal, and separately confirm its policy on AI-assisted artwork before submission.

Graphical abstract examples for real research stories

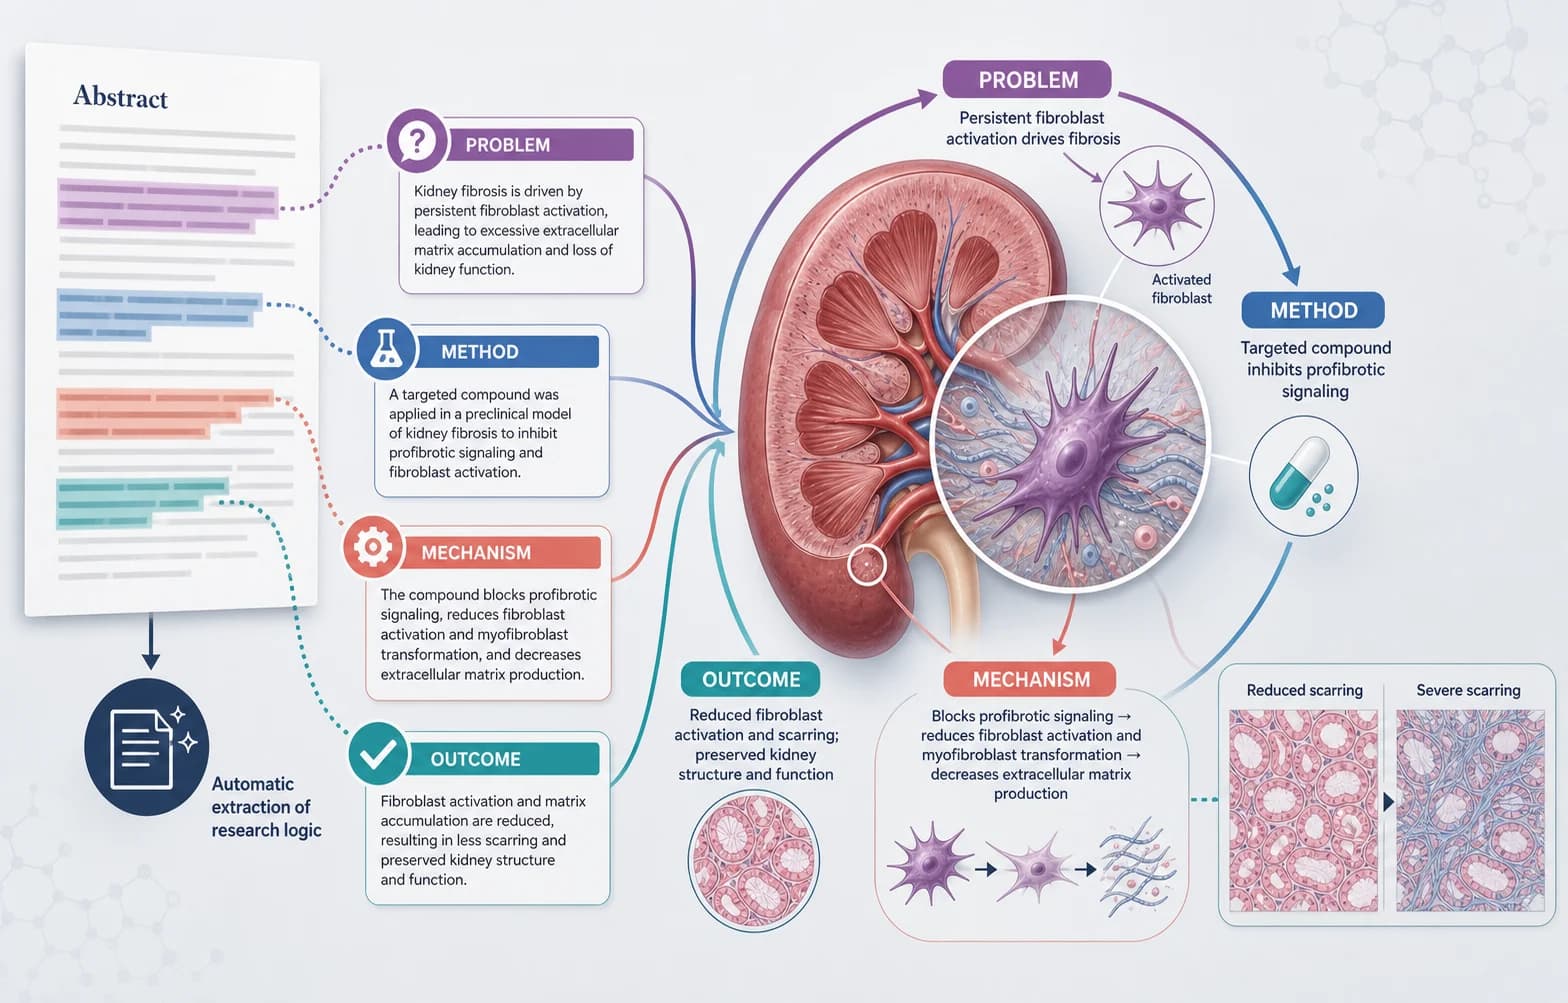
These examples show the intended output: illustrations carry the scientific meaning, while short text anchors the question, process, result, and takeaway.

Built for research communication

Make graphical abstracts for papers, mechanisms, and presentations

Choose a visual structure that matches what readers need to understand: the paper-level story, a mechanism or workflow, or a concise submission-ready summary.

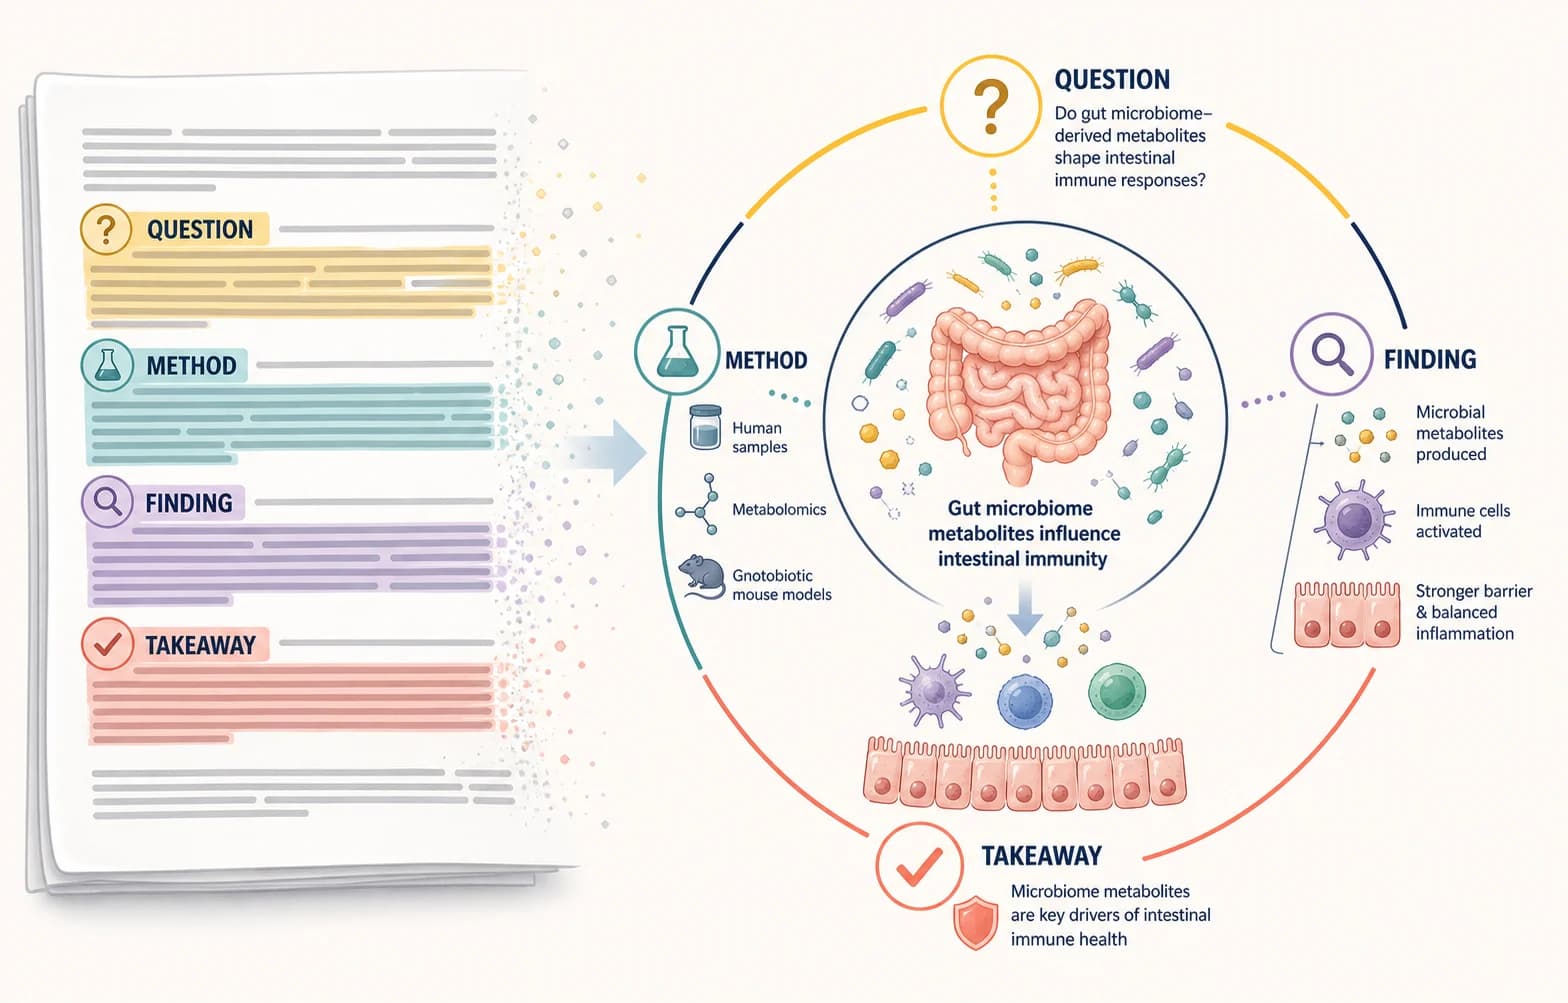
AI graphical abstract showing a research question, method, key finding, and conclusion in a left-to-right story

Turn an abstract into a visual story

Connect the research question, method, key finding, and conclusion in one left-to-right narrative.

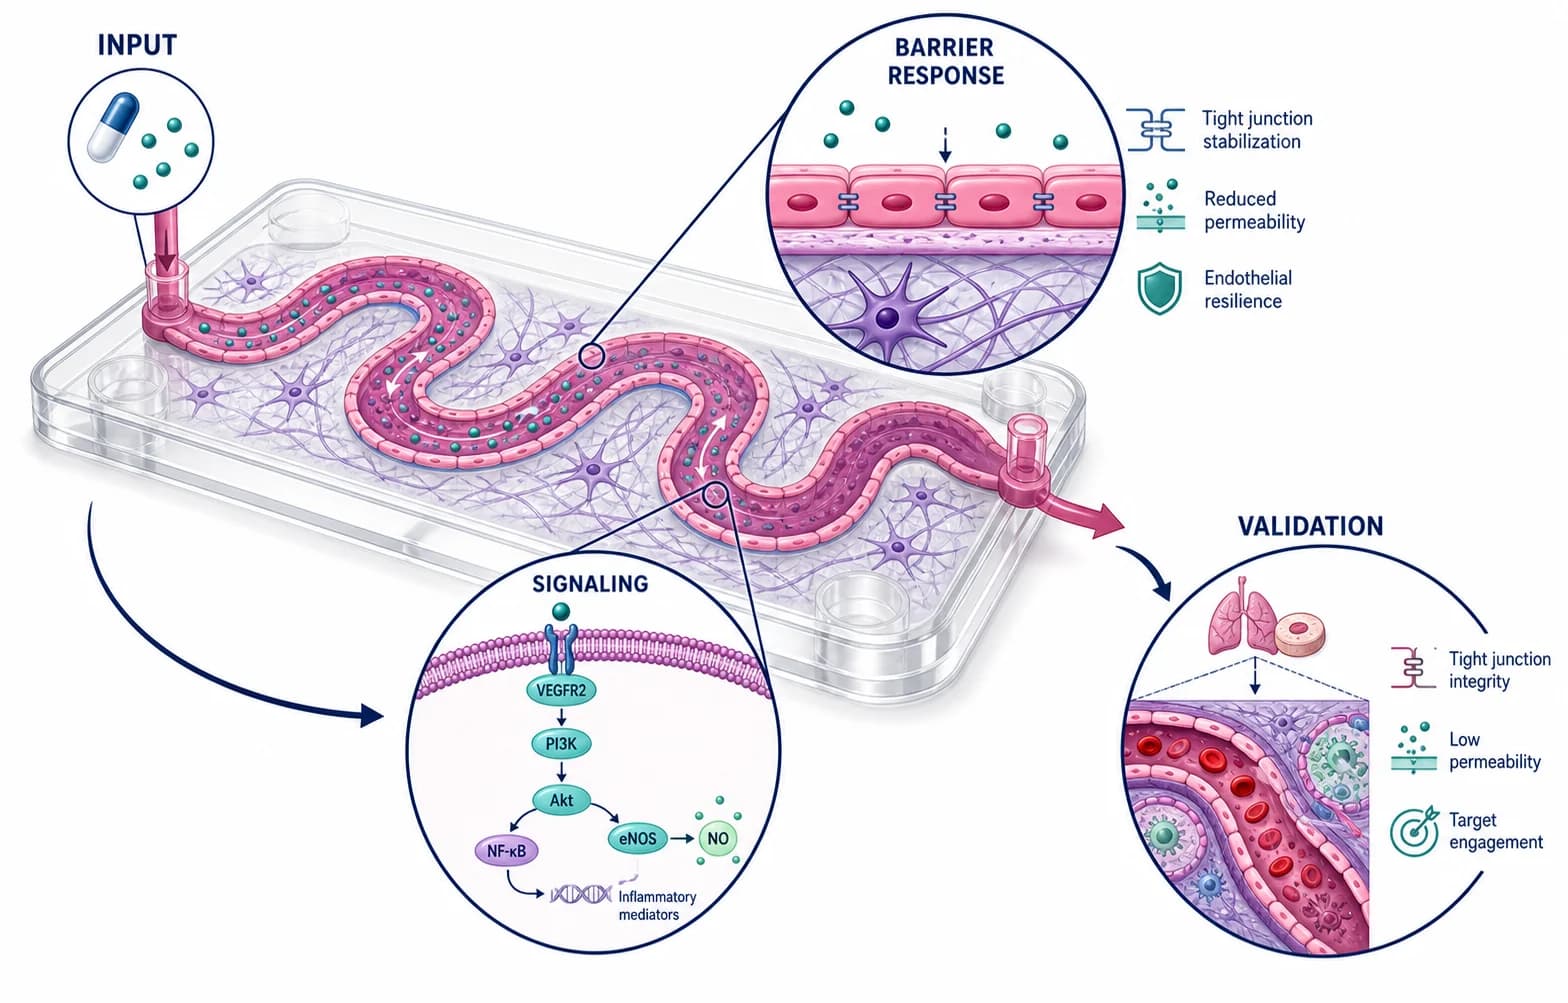
Scientific mechanism workflow connecting treatment, experiment, and causal stages with arrows and labels

Explain mechanisms and workflows

Show how treatments, experiments, systems, or causal steps connect without burying the logic in paragraphs.

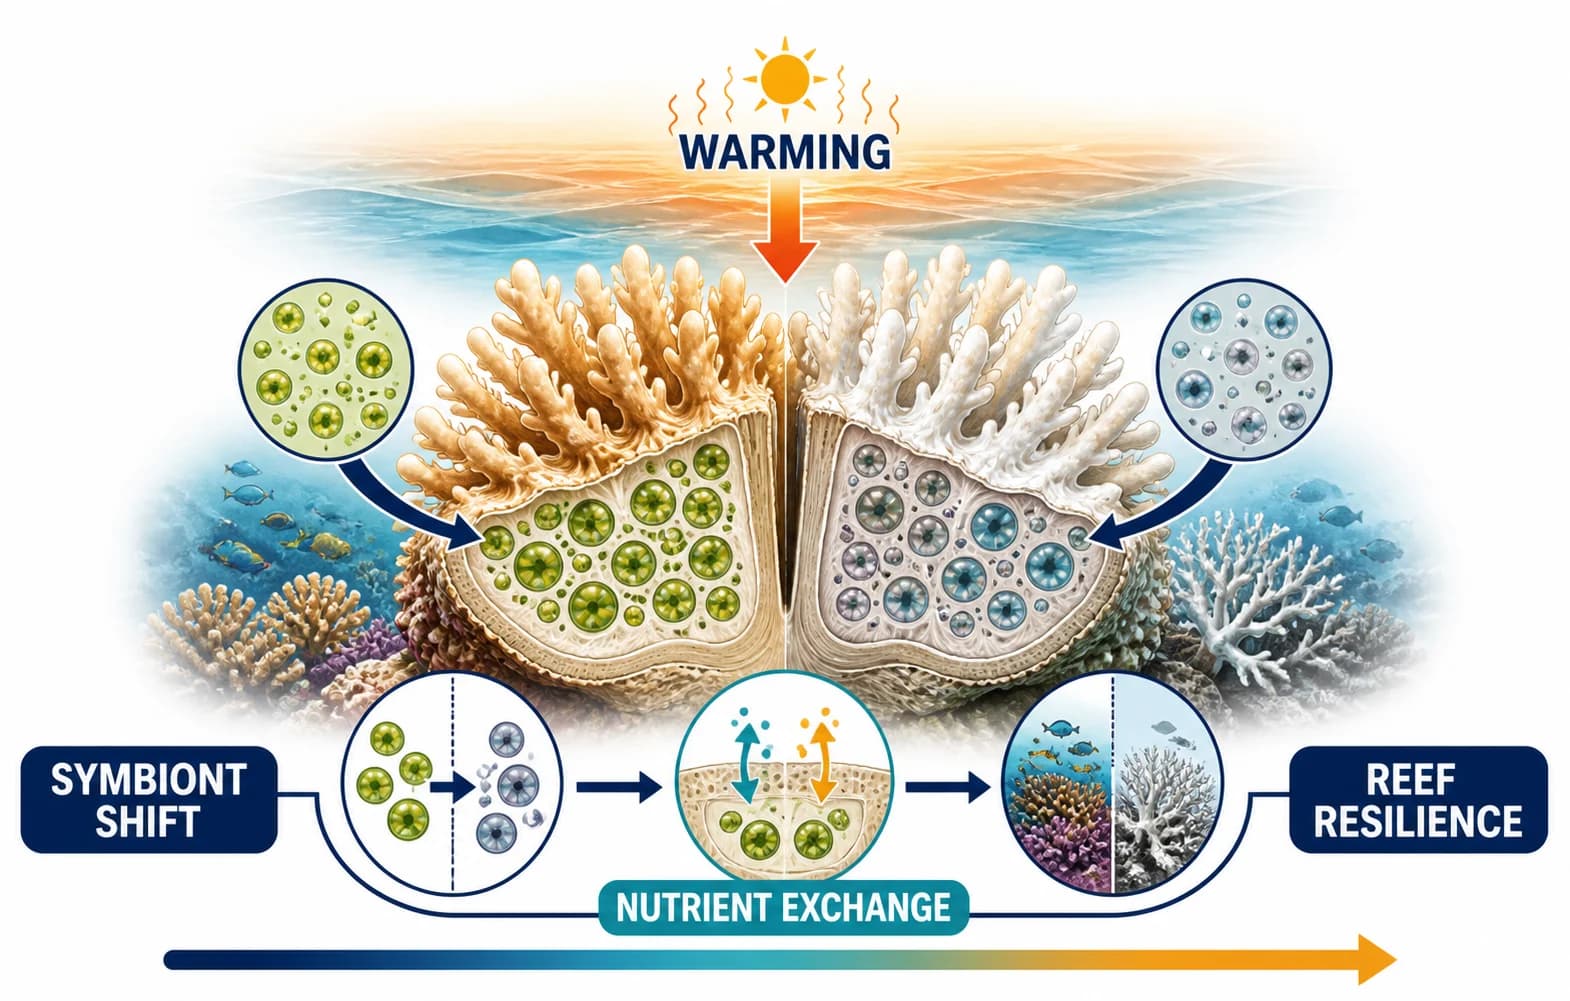
Journal-ready graphical abstract summary prepared for a research paper and scientific presentation

Prepare research for fast reading

Create a compact visual for journal pages, presentations, lab communication, and research promotion.

Graphical abstract capabilities

Create an editable graphical abstract, not a one-shot image

The workflow keeps source material, visual direction, reference images, generation settings, and the final review in one focused path.

01

Structure the research before generation

Provide the question, study object, method, mechanism, key result, conclusion, and any exact terminology that must remain unchanged.

Start with your research story
Graphical abstract planning workspace organizing a research question, method, result, and conclusion
02

Guide the draft with references and patterns

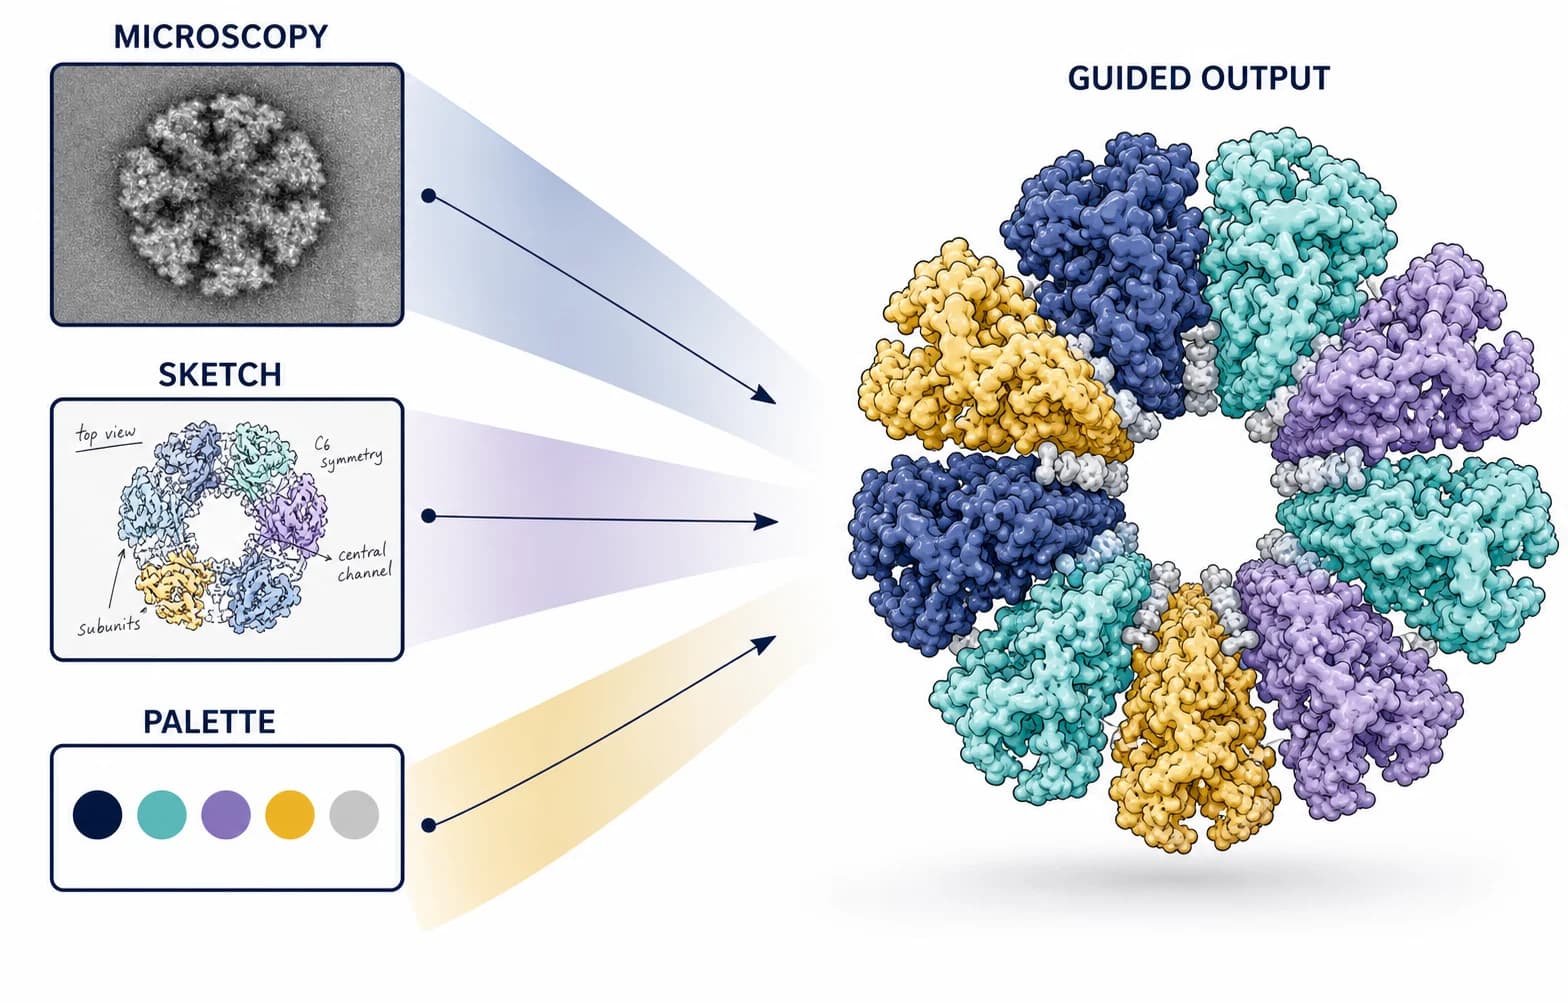
Start from a proven composition and add figures, sketches, or style references when the visual context matters.

Start with your research story
Reference-guided graphical abstract generation using a research figure and a visual pattern
03

Revise labels, arrows, and local details

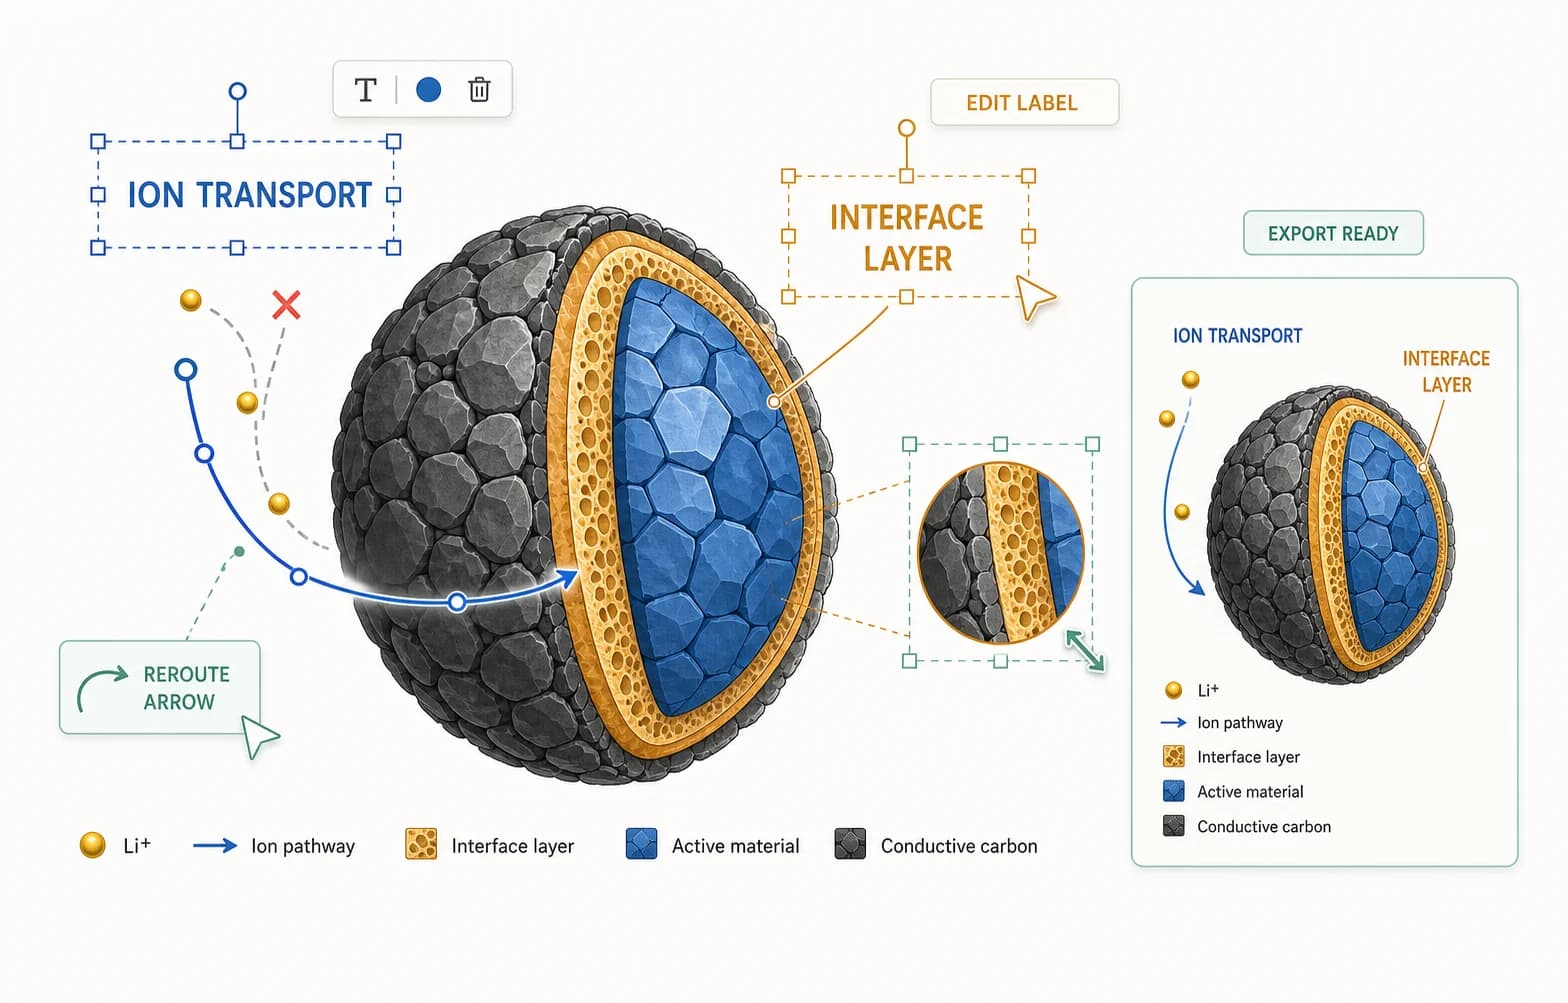
Keep the useful composition while requesting focused changes to hierarchy, text, emphasis, colors, or visual elements.

Start with your research story
Editable graphical abstract workflow revising scientific labels, arrows, colors, and local details
Scientific accuracy

Build a journal-ready graphical abstract from verified research

Generation creates a visual draft, not approved scientific evidence. Review the reading order, terminology, claims, quantities, and journal requirements before export.

Use the manuscript as the source of truth

Check that every panel and arrow follows the actual study design, mechanism, and evidence hierarchy.

Remove invented claims and unsupported detail

Verify molecule names, anatomy, groups, units, effect direction, numbers, and causal relationships.

Review journal and disclosure requirements

Confirm dimensions, text size, file format, resolution, color mode, and current generative-artwork policy.

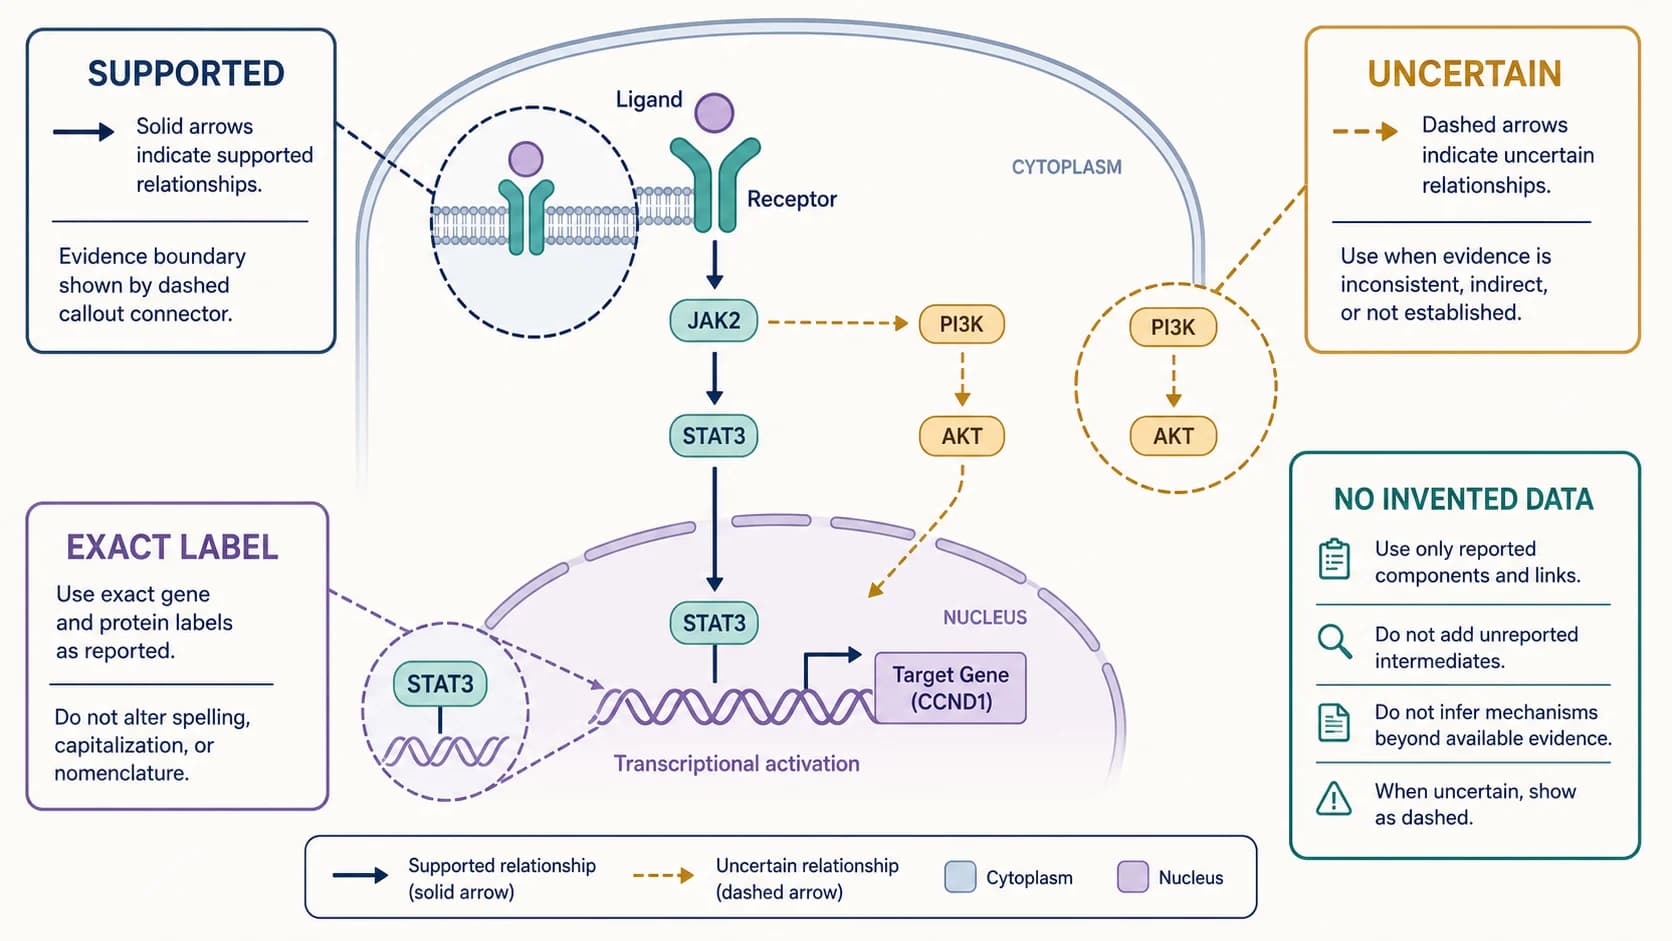
Gene regulation graphical abstract distinguishing supported evidence, uncertain relationships, exact labels, and unsupported claims
A useful draft becomes publication-ready only after every label and relationship is defensible against the paper.Human verified

Why researchers use it

Why researchers use an AI graphical abstract maker

Create the first visual direction quickly, then keep control over the scientific story, terminology, revision path, and final submission checks.

Faster First Draft

Start with a concrete composition

Turn a dense abstract into a visible first draft before spending time arranging every panel manually.

Clear Reading Order

Give readers one clear path

Use a mechanism, process, comparison, or outcome narrative that can be understood at a glance.

Exact Terminology

Preserve research-specific language

Supply exact short labels and review the wording against the terminology already used in the paper.

Coherent Visuals

Keep a consistent visual language

Guide colors, imagery, panel treatment, and hierarchy with references instead of rebuilding the style each time.

Editable Workflow

Make focused revisions

Correct the weak parts of a useful draft instead of restarting the entire composition for every change.

Submission Aware

Prepare for journal review

Build verification, disclosure, legibility, and export checks into the workflow before submission.

Three-step workflow

How to make a graphical abstract from a research paper

Turn the source paper into a visual brief, choose the right composition and references, then review the generated draft before export.

01

Paste the research story

Provide the problem, method, mechanism, key finding, conclusion, and exact labels that must appear.

02

Choose a pattern, references, and model

Select a visual structure, upload useful reference images, and choose the aspect ratio and output detail.

03

Generate, review, and export

Check every label and relationship, revise focused details, and confirm the target journal’s requirements.

Create your graphical abstract
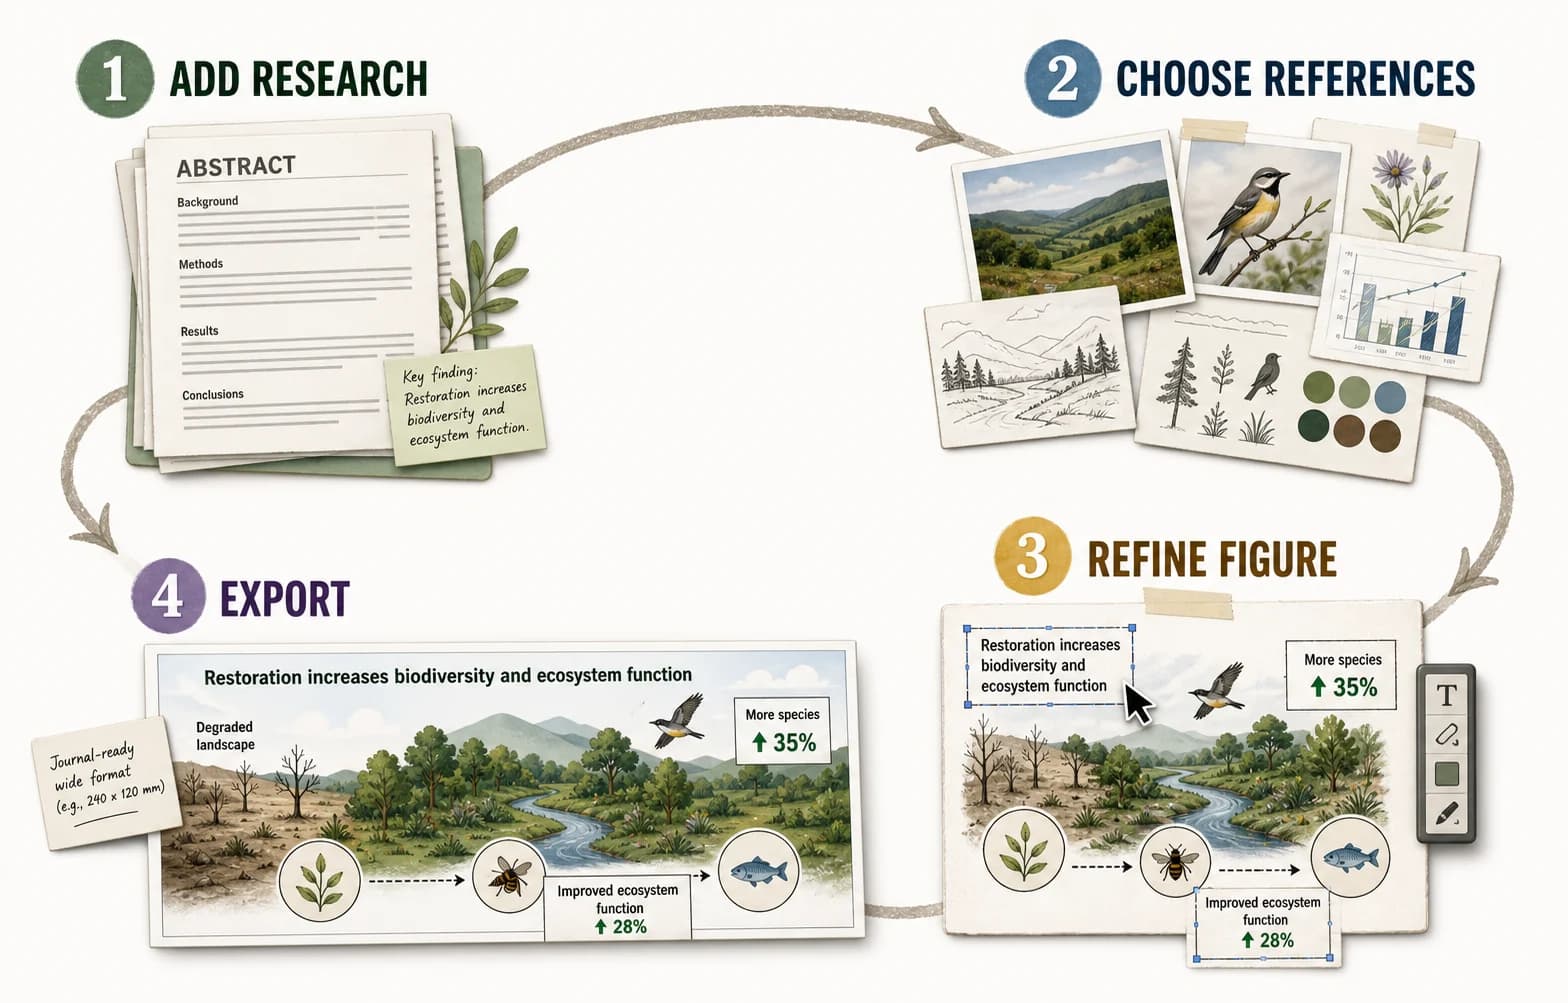
Four-step graphical abstract workflow from adding research and references to refining and exporting the final figure
The strongest workflow separates visual drafting from scientific approval.

PaperBananaプラン

PaperBanana の各プランを比較。AI 科学イラスト、画像編集、SVG 図版ワークスペース、ポスターメーカー、透かしなし書き出し、上位モデルに対応します。

Basic

$19$9.5/月
$114/年🔥 50%お得
1枚あたりのコスト
≈ $0.18/枚
  • 5,040クレジット/年
  • =630点の学術イラスト
  • 商用ライセンス(年払いのみ)
  • 無料ユーザー待機なしの優先生成
  • 透かしなしダウンロード
  • GPT Image 2、Nano Banana、Nano Banana Pro、Nano Banana 2 に対応
  • Scientific Illustration:SVG 学術イラストを生成
  • Scientific Diagram Maker:学術イラスト用テンプレートから編集可能な SVG 図を生成
  • Poster Maker:論文/PDF から学術ポスターを作成
人気

Plus

$39$19.5/月
$234/年🔥 50%お得
1枚あたりのコスト
≈ $0.14/枚
  • 12,960クレジット/年
  • =1,620点の学術イラスト
  • 商用ライセンス
  • 無料ユーザー待機なしの優先生成
  • 透かしなしダウンロード
  • GPT Image 2、Nano Banana、Nano Banana Pro、Nano Banana 2 に対応
  • Scientific Illustration:編集可能な SVG 学術イラストを生成
  • Studio:既存画像の選択範囲を部分編集
  • Poster Maker:論文/PDF から学術ポスターを作成
  • Diagram Maker:学術イラスト用テンプレートから編集可能な SVG 図を生成

Enterprise

$69$34.5/月
$414/年🔥 50%お得
1枚あたりのコスト
≈ $0.12/枚
  • 28,800クレジット/年
  • =3,600点の学術イラスト
  • 商用ライセンス
  • 無料ユーザー待機なしの優先生成
  • 透かしなしダウンロード
  • GPT Image 2、Nano Banana、Nano Banana Pro、Nano Banana 2 に対応
  • Scientific Illustration:チーム向け SVG 学術イラストを生成
  • Studio:既存の研究画像の選択範囲を部分編集
  • Poster Maker:論文/PDF から学術ポスターを作成
  • Diagram Maker:学術イラスト用テンプレートから編集可能な SVG 図を生成
  • 専用サポート(2時間以内に返信)(年払いのみ)

いつでもキャンセル可能 · サブスクリプションクレジットは30日間有効

MastercardVisaDiscoverAmerican ExpressStripePayPal
安全な決済 · 256ビット SSL 暗号化

Continue the research workflow

More tools for scientific figures and research posters

Move to a focused illustration, a larger presentation format, an editable diagram, or a figure-refinement workspace when the graphical abstract is not the final deliverable.

Biomedical mechanism created in the scientific illustration workspace

Scientific Illustration

Explain one structure, mechanism, pathway, or device with more visual detail than a paper-level summary allows.

Conference poster displayed in the scientific poster maker workspace

Scientific Poster Maker

Turn a full paper into a larger conference format with methods, results, figures, and author information.

Editable scientific workflow diagram with structured labels and connectors

Scientific Diagram Maker

Build an editable workflow, study design, architecture, or process diagram when exact connectors and labels matter.

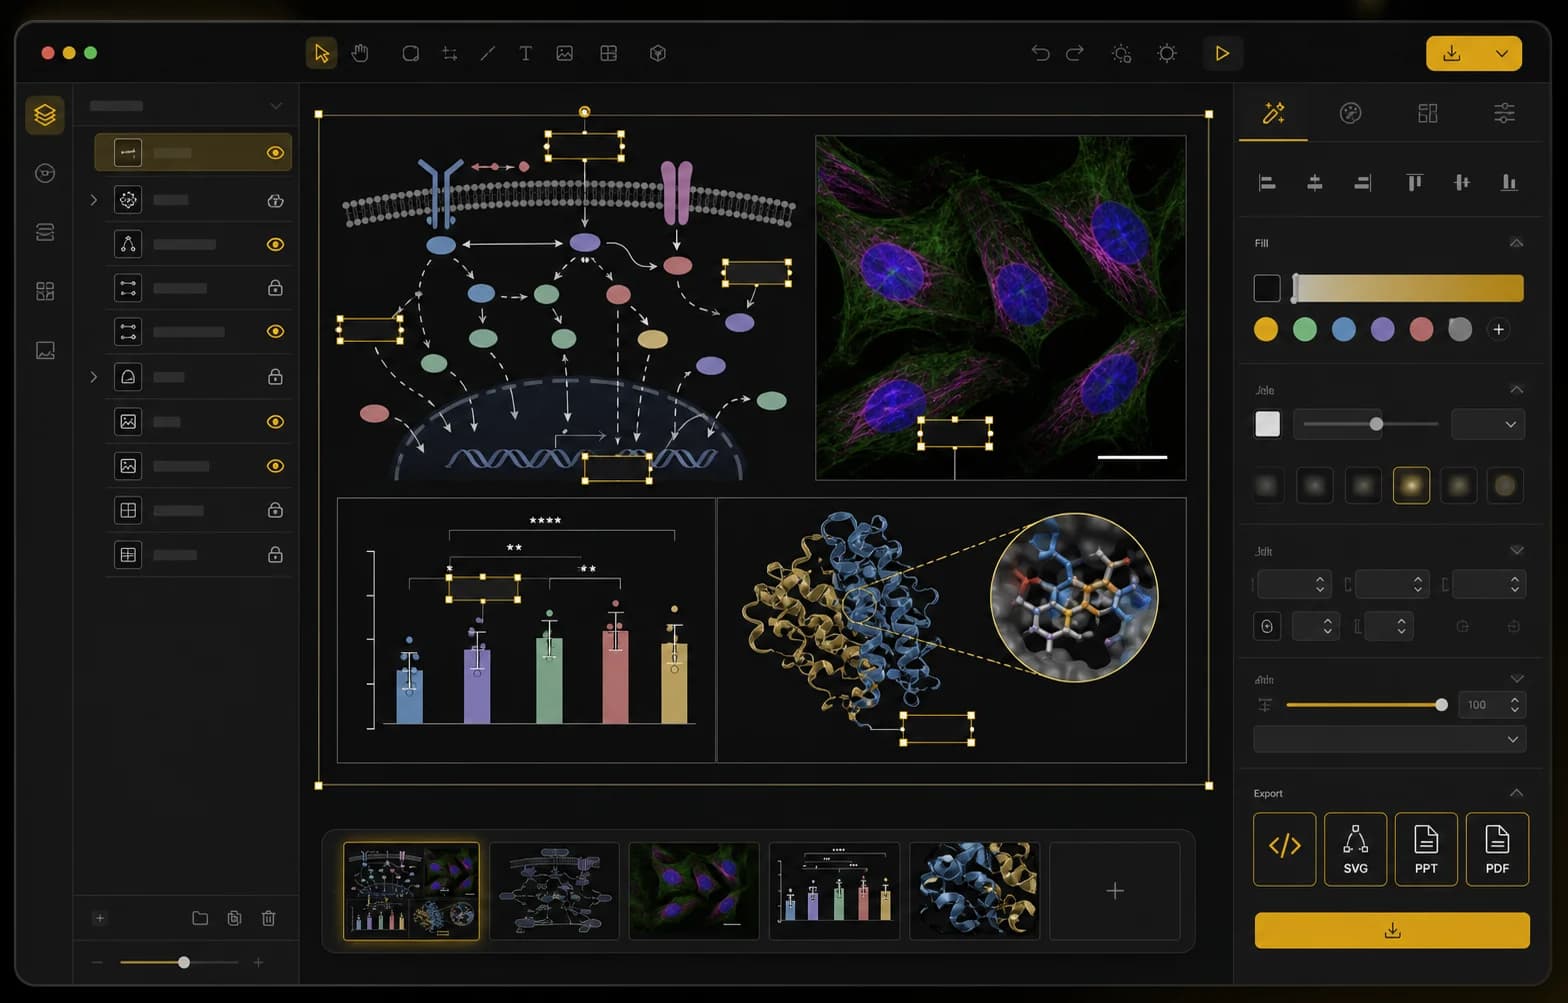
Scientific figure editor workspace with editable research figure panels and annotations

Scientific Figure Editor

Refine an existing scientific figure, adjust labels and annotations, and prepare a clean publication-ready revision.

Graphical abstract FAQ

Graphical Abstract Maker questions from researchers

What is a graphical abstract for a research paper?+

A graphical abstract is a single visual summary of a research paper. It combines scientific illustrations, concise labels, arrows, and a clear reading order to communicate the study question, method or mechanism, key result, and main conclusion without reproducing every section of the manuscript.

How do I make a graphical abstract from a research paper?+

Start by extracting the research question, method, mechanism, key finding, and conclusion. Arrange those elements in one logical reading path, generate or add the supporting scientific visuals, then verify every label, arrow, quantity, and relationship against the paper before export.

What should I paste into an AI graphical abstract maker?+

Paste a structured summary containing the research question, study object or population, method, mechanism, key result, and conclusion. Include exact terminology, required numbers, and the intended reading order. Remove background details that do not clearly support the central visual story.

Can AI generate a graphical abstract from a research paper?+

Yes. AI can turn a structured paper summary into a visual first draft with illustrations, short labels, and a reading order for further review. The author must still verify every scientific term, arrow, quantity, relationship, and conclusion against the manuscript before submission.

Can I edit text, arrows, and visual details after generation?+

Yes. PaperBanana’s edit workflow supports focused revisions to labels, arrows, colors, icons, emphasis, and local image details while preserving a useful overall composition. Review the complete figure after each change because a generative edit can also affect nearby text or visual relationships.

What size and resolution should a graphical abstract be?+

There is no universal size. Many graphical abstracts use a landscape layout, but exact dimensions, file format, resolution, color mode, and minimum text size depend on the publisher, journal, and article type. Always check the current author guidelines before export.

Will journals accept an AI-generated graphical abstract?+

Journal policies differ and can change. Some publishers restrict generative artwork, require disclosure, or assess AI-assisted figures case by case. Check the target journal’s current author guidelines and artwork policy before preparing the final submission file; technical quality alone does not guarantee acceptance.

Should I use a graphical abstract template or an AI maker?+

Use a template when your content already fits a known layout and you want complete manual control. Use an AI graphical abstract maker when you need help turning dense research into a first visual structure, then edit and verify the generated draft.

Make the paper understandable at a glance

Create a graphical abstract with images and concise research text

Start from the paper’s central story, generate a wide visual draft, and revise the scientific details before you export or submit it.

Create Your Graphical Abstract