• Logo
    PaperBananaAI Academic Illustration Generator
Home
  • Home
  • Studio
  • Scientific Illustration Generator
  • Poster Maker
  • Diagram Maker
  • Figure Editor
  • Pricing
My Creations
  • My Creations
  • Invite Friends
LogoPaperBanana
HomePricingInvite Friends
LogoPaperBanana

PaperBanana - AI-powered academic illustration generator

support@paperbanana.me

AI Tools

  • All Tools
  • Text to Illustration
  • Scientific Illustration Generator
  • Figure Editor
  • Diagram Maker
  • Poster Maker

Support

  • About
  • Pricing
  • Contact

Legal

  • Privacy Policy
  • Terms of Service
  • Acceptable Use

© 2026 PaperBanana. All Rights Reserved.

PricingContact

Cause and Effect Graphic Organizer for Maps and Chains

Turn a topic into a clear cause-and-effect map. Choose multiple causes and effects or a sequential event chain, edit every card, and download a filled example or blank printable worksheet without an account or watermark.

Organizer layout
Causes
Cause 1
Cause 2
Effects
Effect 1
Effect 2
Worksheet options
Reasoning depth

Evidence mode adds a second field to every relationship so learners explain why the cause leads to the event instead of treating sequence as proof.

Worksheet version
Print palette

Your worksheet stays in this browser while you edit. No signup or upload is required.

Causes → Event → Effects

Printable organizer preview

Live
The American RevolutionGrades 6–8CAUSESEVENTEFFECTSTaxation withoutrepresentationColonial resistance growsAmerican RevolutionDeclaration of IndependenceA new nation is formedName: ______________________________Date: __________________

For a strong organizer, write each cause and effect as a specific, evidence-based statement—not just a topic word.

What this organizer shows

What Is a Cause and Effect Graphic Organizer?

A cause and effect graphic organizer is a visual thinking tool that connects why something happens to the results it produces. Causes appear before a central event, effects follow it, and arrows show the direction of the relationship. Event-chain layouts show how one effect can become the next cause.

The relationship is not always one-to-one. A historical event may have several causes and several consequences. A science process or story may be better shown as a chain in which each effect becomes the next cause.

Use the organizer before writing to collect evidence, during reading to track relationships, or after a lesson to check whether learners can explain more than a simple sequence. Evidence + mechanism mode adds a why field to every relationship, so the exported worksheet records the reasoning behind each arrow.

01

Cause

The action, condition, or reason that helps produce an event.

02

Central event

The outcome or turning point the organizer is trying to explain.

03

Effect

A result or consequence that follows the event.

04

Mechanism + evidence

The explanation of how the cause produces the result, supported by text details, observations, or facts.
Cause and Effect Graphic Organizer Examples

Load a history, science, literature, or environmental example, then replace the statements with evidence from your lesson.

Across subjects

Use Cause and Effect Organizers Beyond Reading Practice

The same structure supports historical explanation, literary analysis, science processes, and real-world systems thinking.

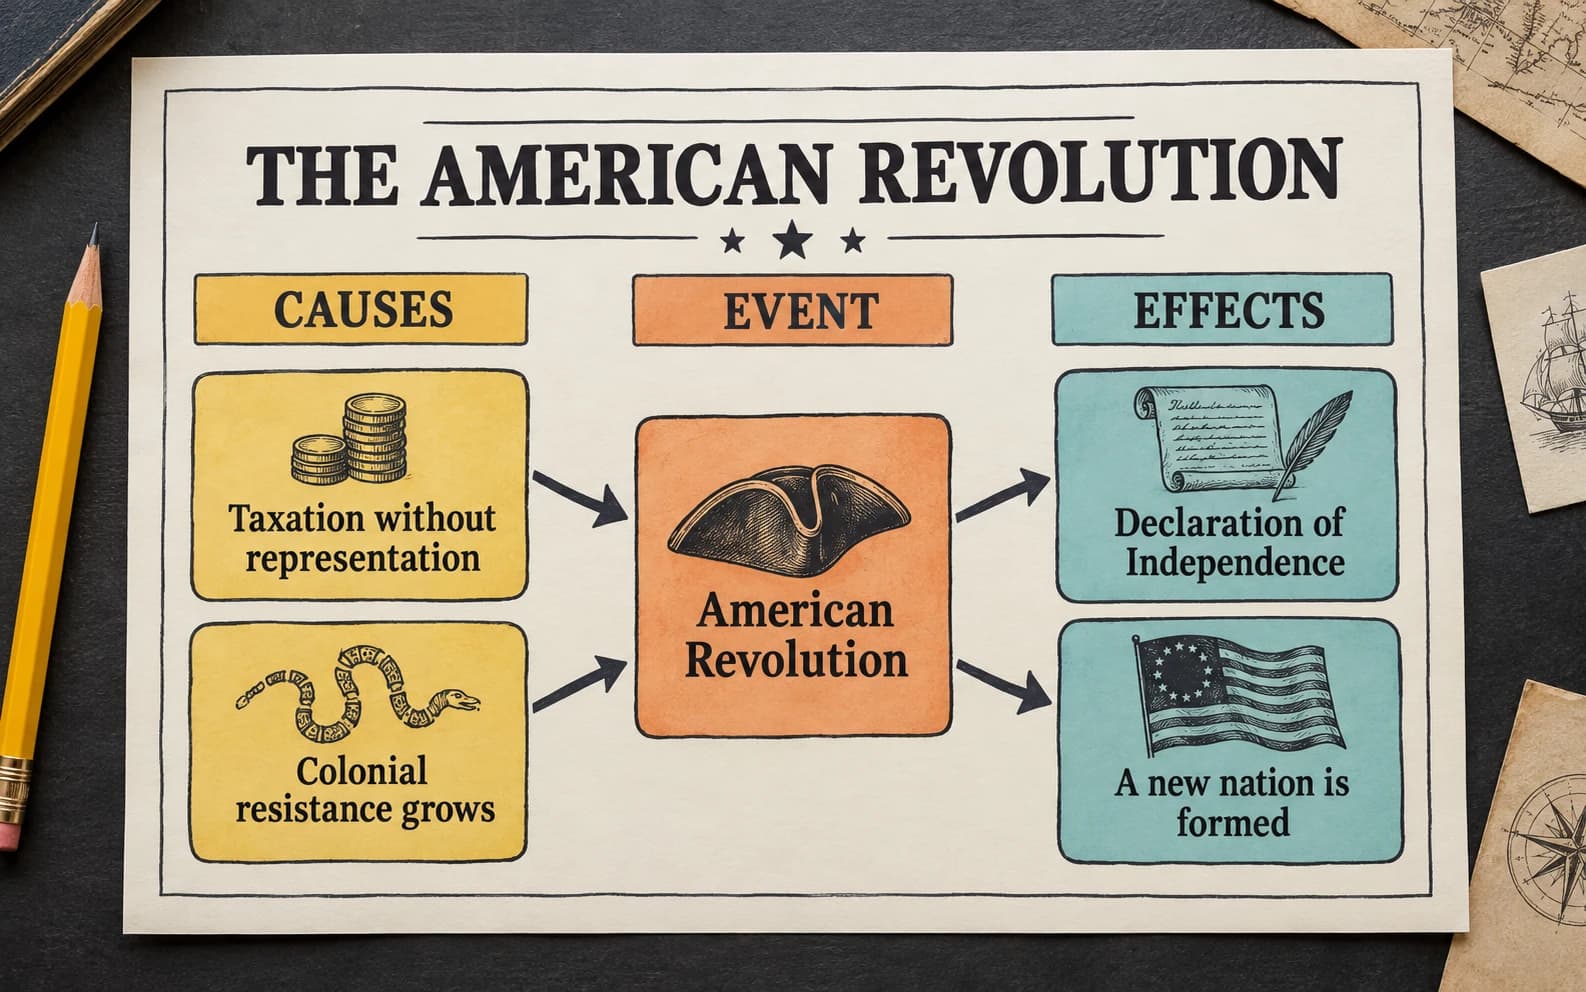
American Revolution cause and effect history worksheet

Explain historical events

Separate long-term conditions, immediate triggers, and later consequences instead of memorizing an isolated date.

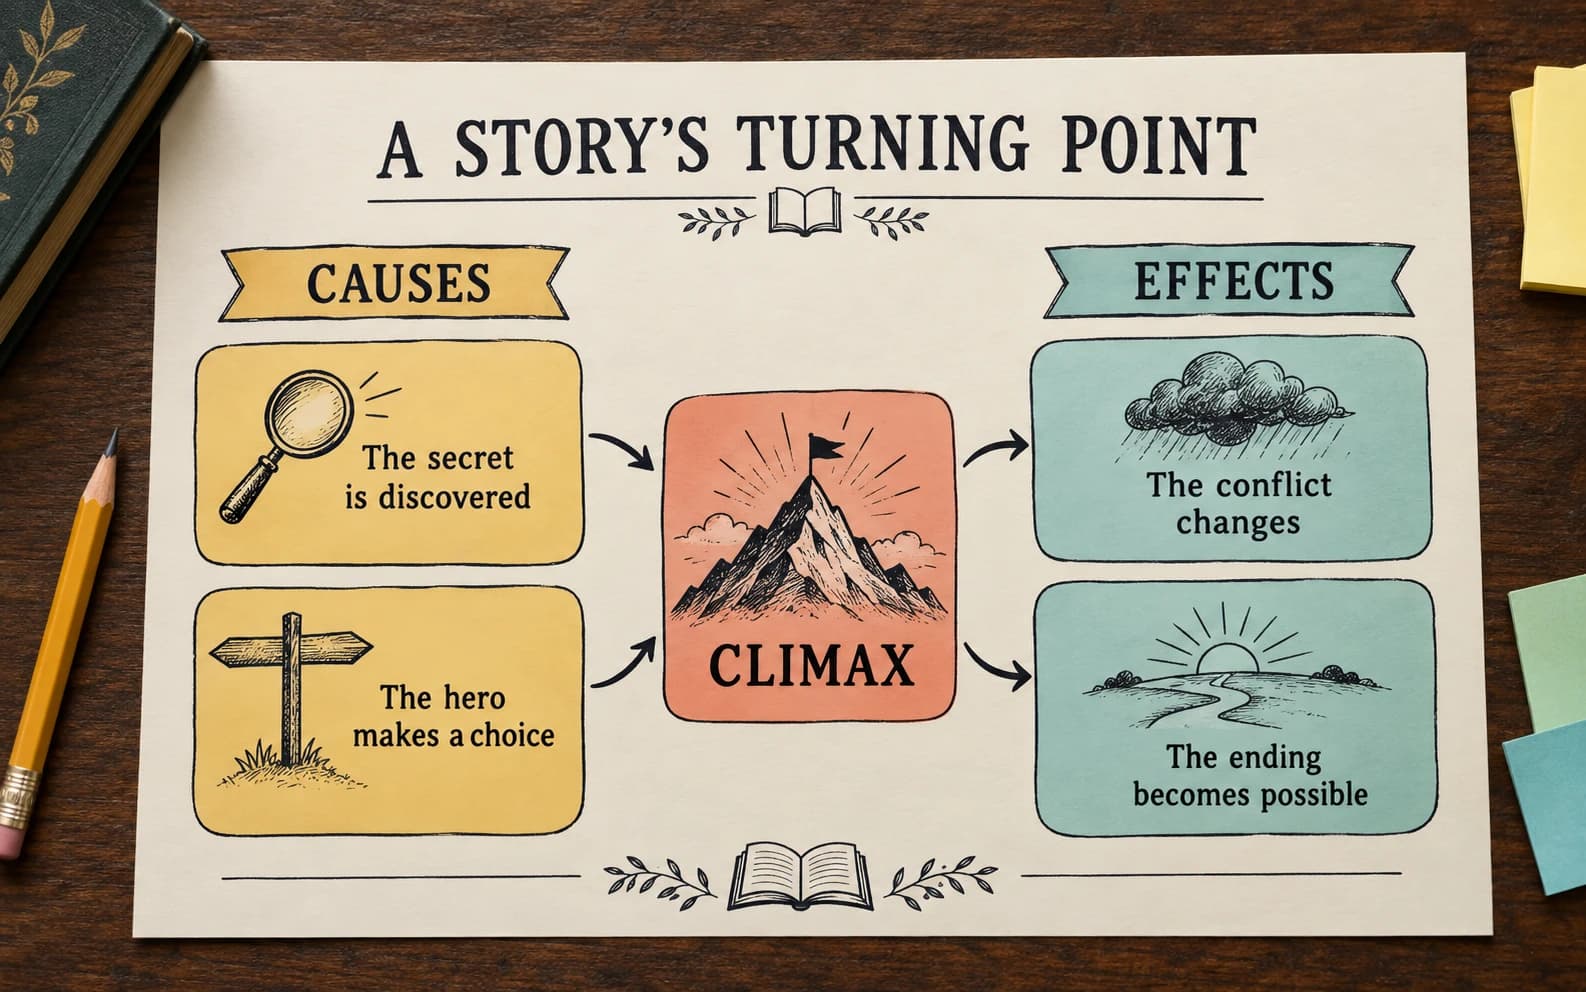
Literature cause and effect organizer centered on a story climax

Analyze plot and character choices

Connect actions and motivations to a climax, resolution, or change in a character.

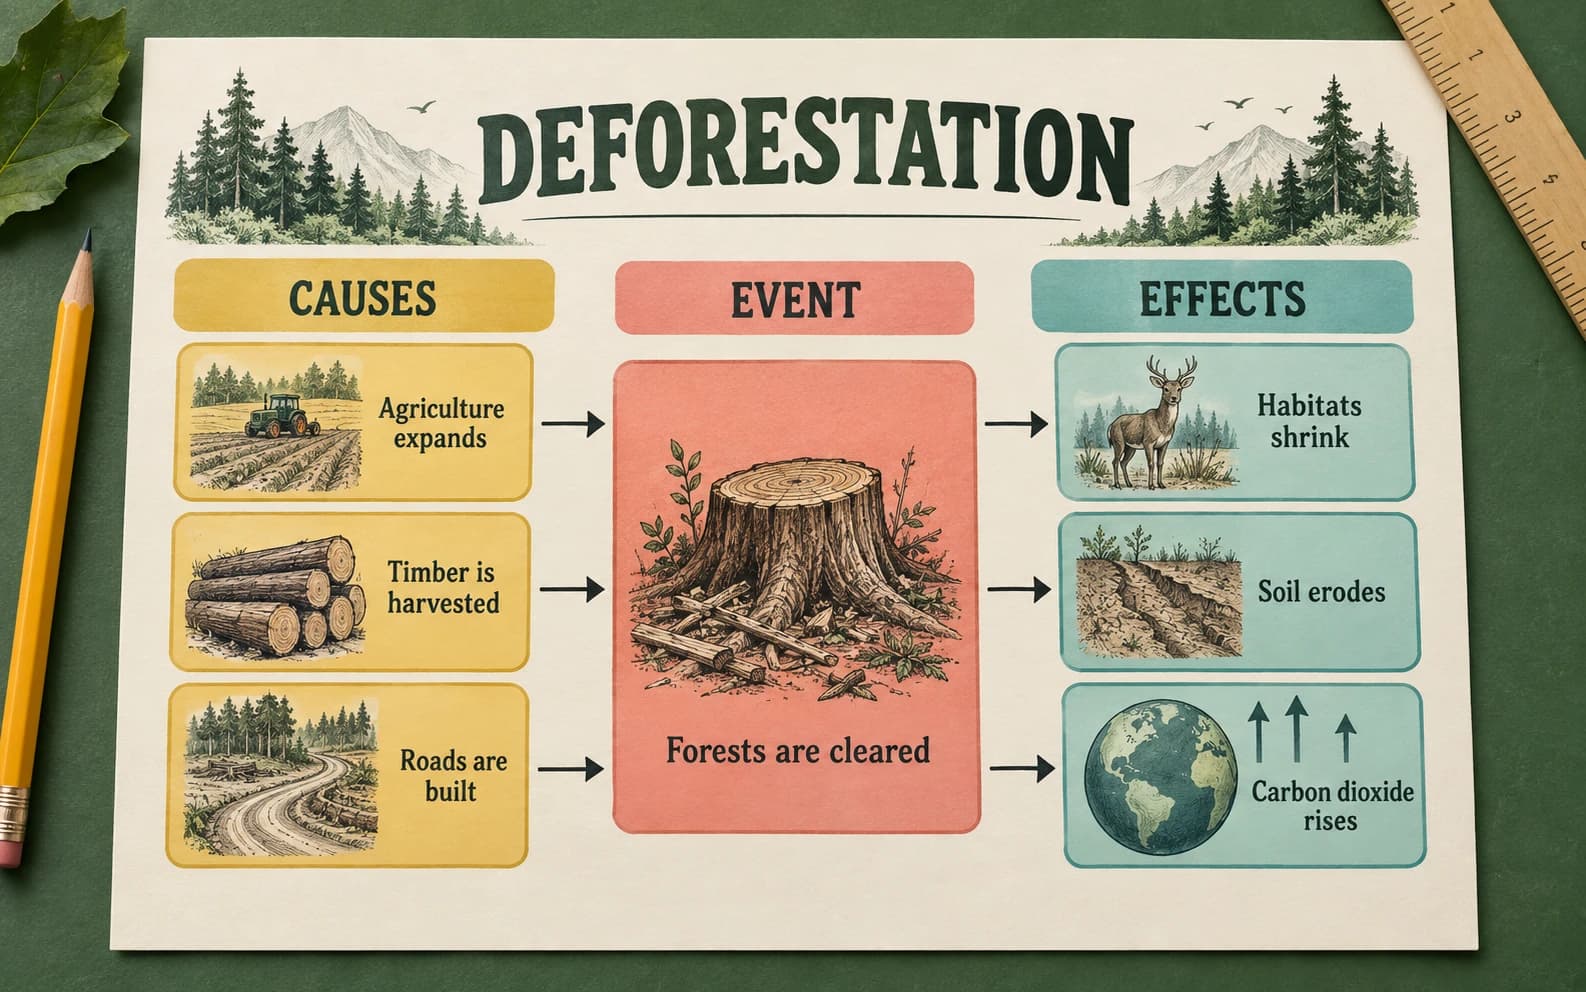
Environmental cause and effect organizer about deforestation

Model science and social systems

Show how environmental, biological, or social changes create linked outcomes and feedback.

Purpose-built maker

Build and Defend the Relationship, Not Just a Pretty Template

The editor keeps the reasoning structure intact and adds an optional evidence layer that most printable templates leave out.

Add evidence and a mechanism to every relationship

Turn on Evidence + mechanism mode to place a second field under every cause, effect, or chain step. The explanation is included in the live preview, SVG, PNG, and printable PDF.

Create a Cause and Effect Organizer
Cause and effect workflow with an evidence and mechanism layer

Choose branching or sequential logic

Use causes → event → effects for one central outcome, or switch to an event chain when each result produces the next step.

Create a Cause and Effect Organizer
Editable cause and effect event chain with multiple steps

Create teacher and student versions

Keep the filled organizer and its reasoning notes as a model, then switch to blank mode for an independent student task.

Create a Cause and Effect Organizer
Filled and blank cause and effect worksheet versions
Choose the right layout

Cause-and-Effect Map vs. Event Chain

Select the organizer that matches the relationship in the source. A branching map explains several inputs or outcomes; an event chain explains order and dependency.

Use a branching map for many-to-one or one-to-many

Choose it when several factors contribute to one event, or when one event produces several different consequences.

Use an event chain for linked consequences

Choose it when the effect of one stage becomes the cause of the next, as in processes, plot sequences, and cascading events.

Record the reason, not just the arrow

An earlier event is not automatically a cause. Evidence + mechanism mode makes learners state the trigger, process, or source detail that supports each link.

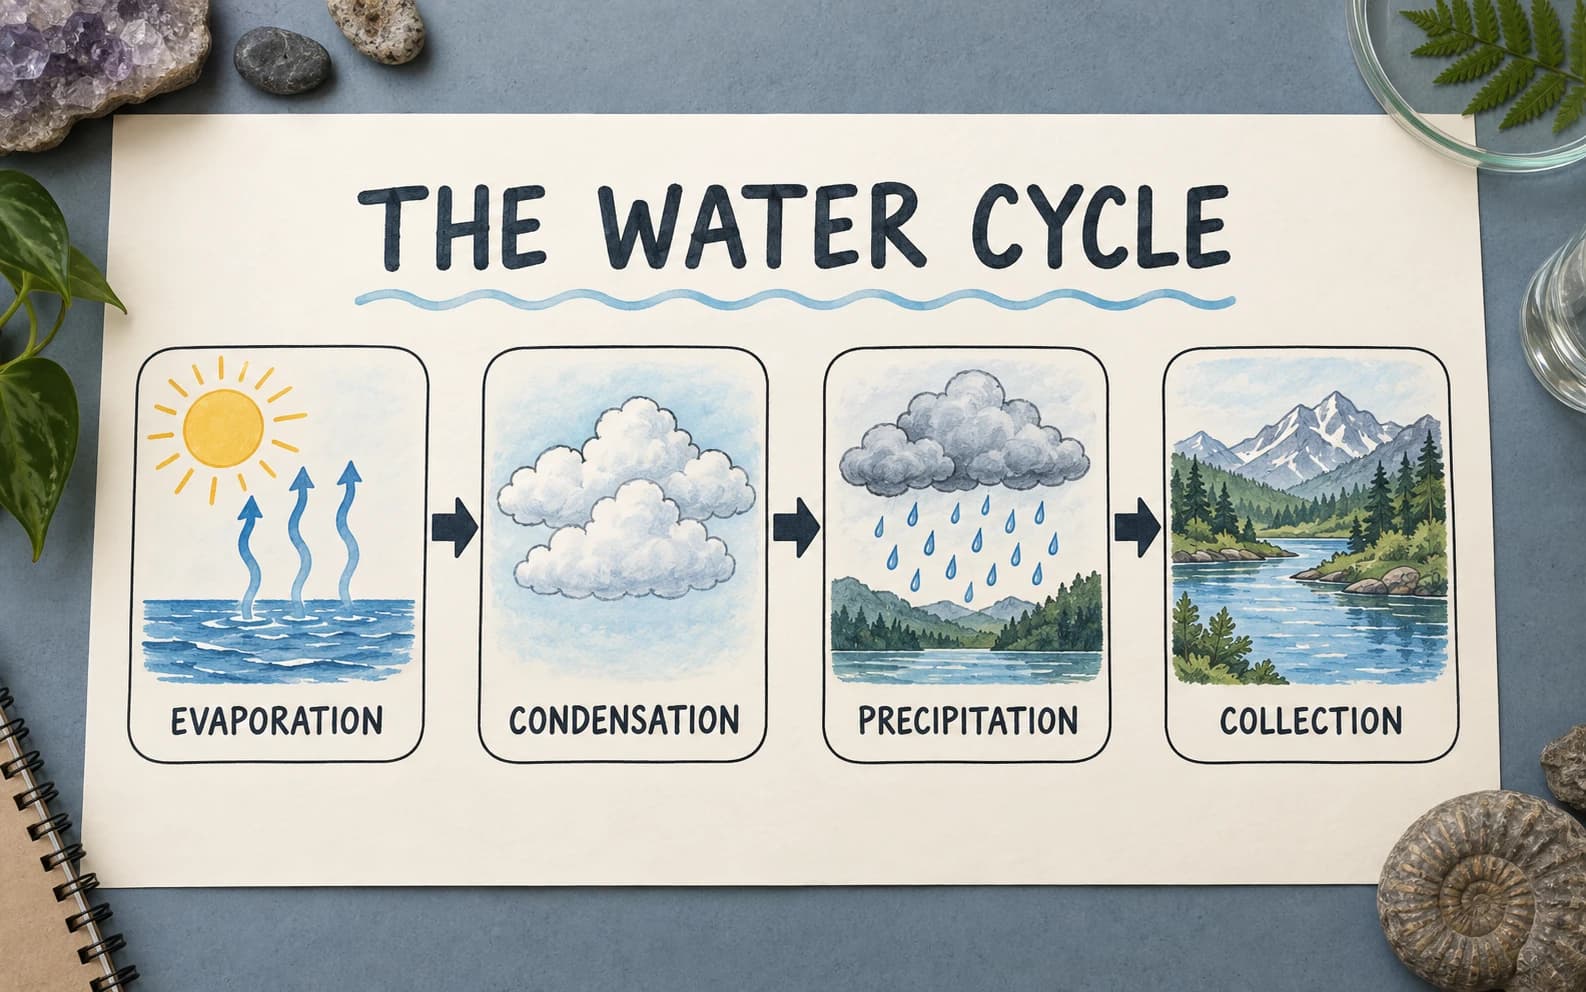
Water cycle event chain demonstrating sequential cause and effect
An event chain works when every arrow can be read as: this leads to the next step.Layout guide

Ready for class

Printable Cause and Effect Worksheets for Teachers and Students

Go from lesson evidence to an editable, printable organizer without opening a generic design editor.

No Account

No signup wall

Open the page, edit the organizer, and export without creating an account.

Clean Export

No watermark

Downloaded and printed worksheets stay clean for school and professional use.

Evidence Mode

Causal reasoning layer

Add a why or evidence note beneath every relationship and carry it into the exported worksheet.

Two Versions

Filled and blank

Create a teaching model and a student worksheet from the same organizer.

B&W

Ink-saving mode

Switch to black and white before photocopying or saving a PDF.

Local

Private by default

Typed lesson content remains in the current browser while you work.

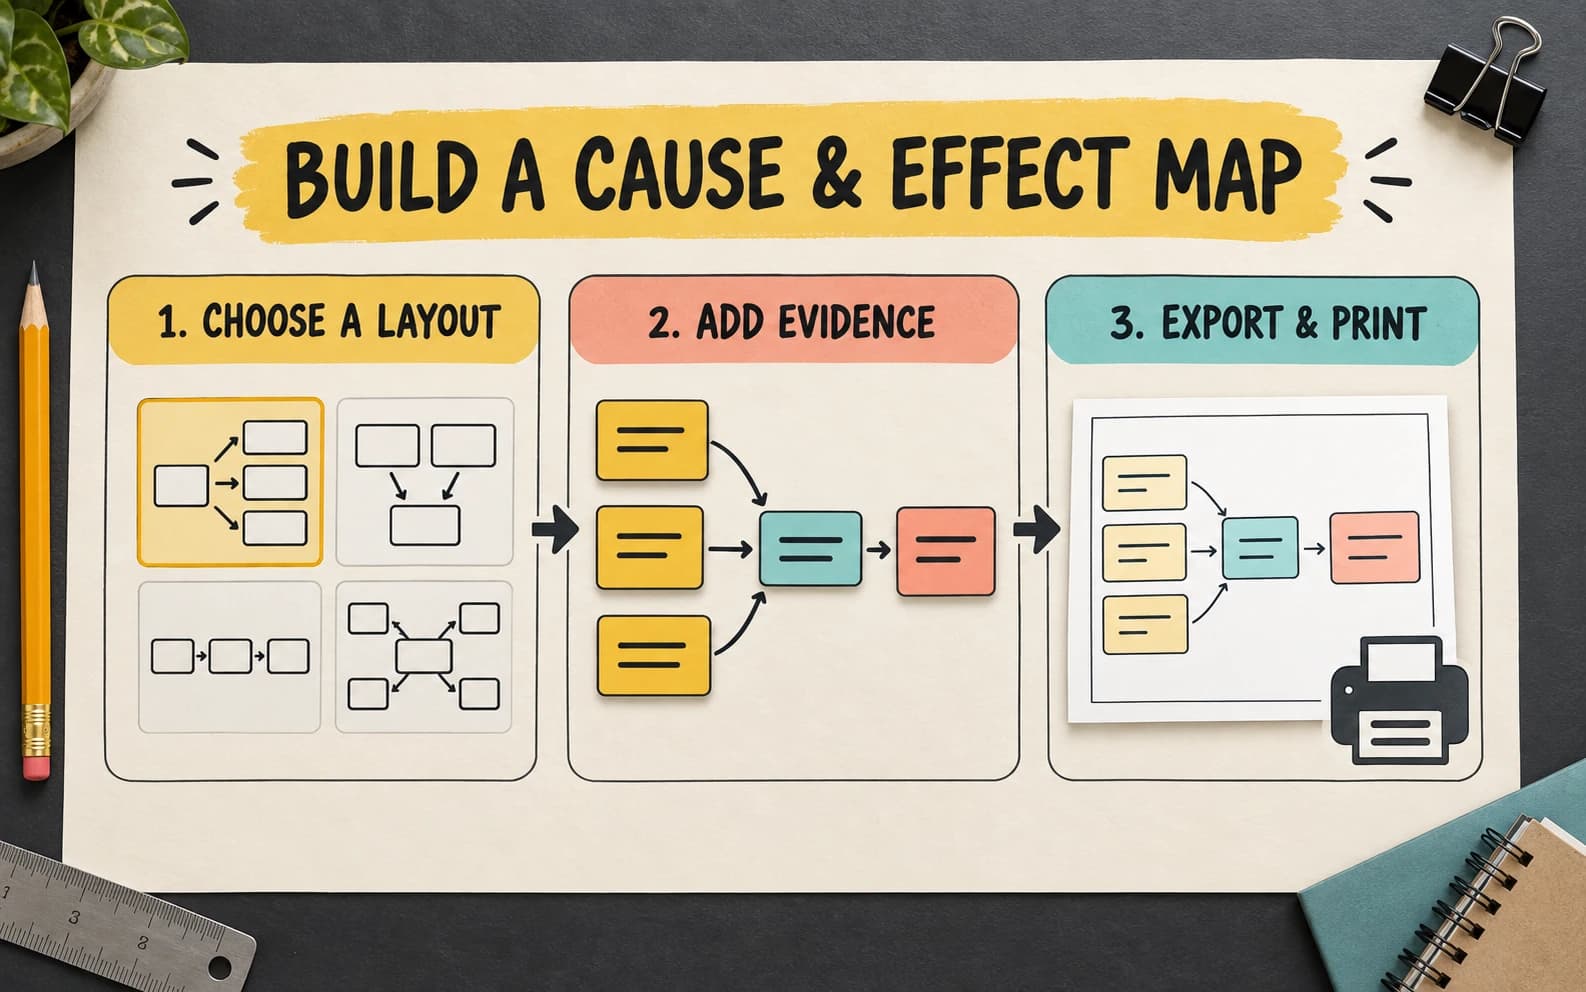
Three simple steps

How to Make a Cause and Effect Graphic Organizer

Match the layout to the relationship, add evidence, and export the version learners need.

01

Choose a relationship layout

Select causes → event → effects for branching logic, or event chain for a step-by-step sequence.

02

Add the mechanism and evidence

Turn on Evidence + mechanism, then explain how each cause produces the result or cite the source detail that supports the arrow.

03

Download or print

Choose filled or blank, color or black-and-white, then export SVG, PNG, or a printable PDF.

Start the Cause and Effect Maker
Three-step workflow for building and exporting a cause and effect map
Choose the logic first, add evidence second, and export a clean classroom worksheet last.

Keep organizing ideas

Related Graphic Organizer Tools

Choose a broader template collection, activate prior knowledge, develop vocabulary, or compare concepts.

Collection of editable graphic organizer templates

Graphic Organizer Maker

Browse multiple visual thinking structures for reading, planning, and classroom discussion.

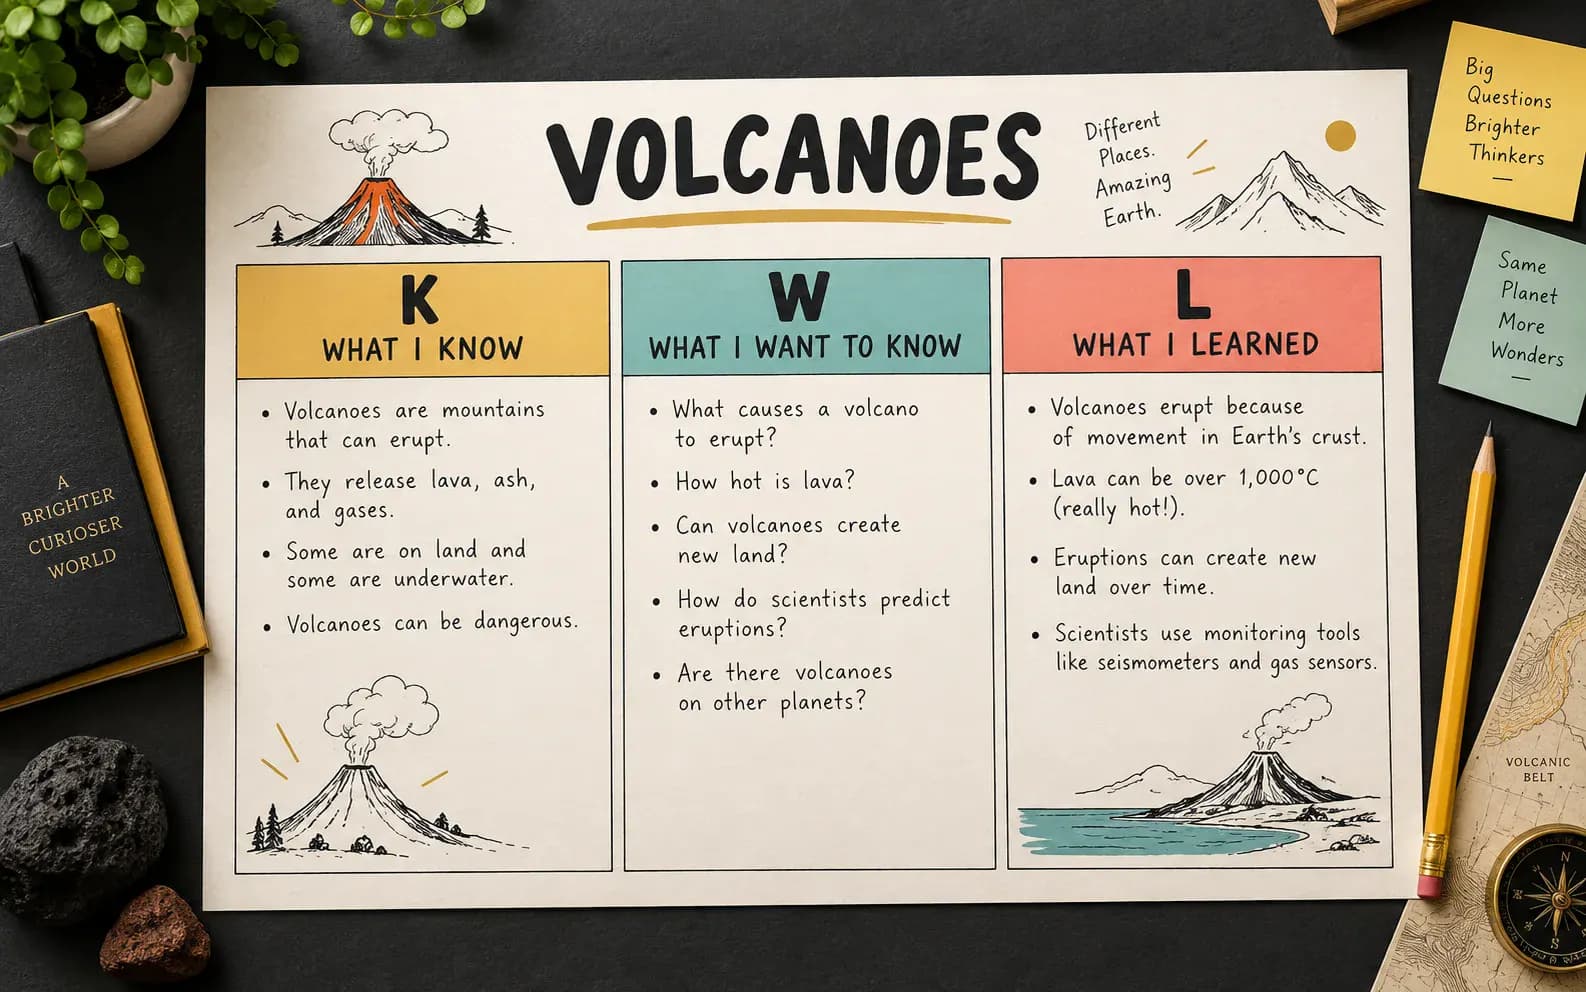
Editable KWL chart for classroom learning

KWL Chart Maker

Track what learners know, want to know, and learn before, during, and after instruction.

Printable Frayer model vocabulary organizer

Frayer Model Maker

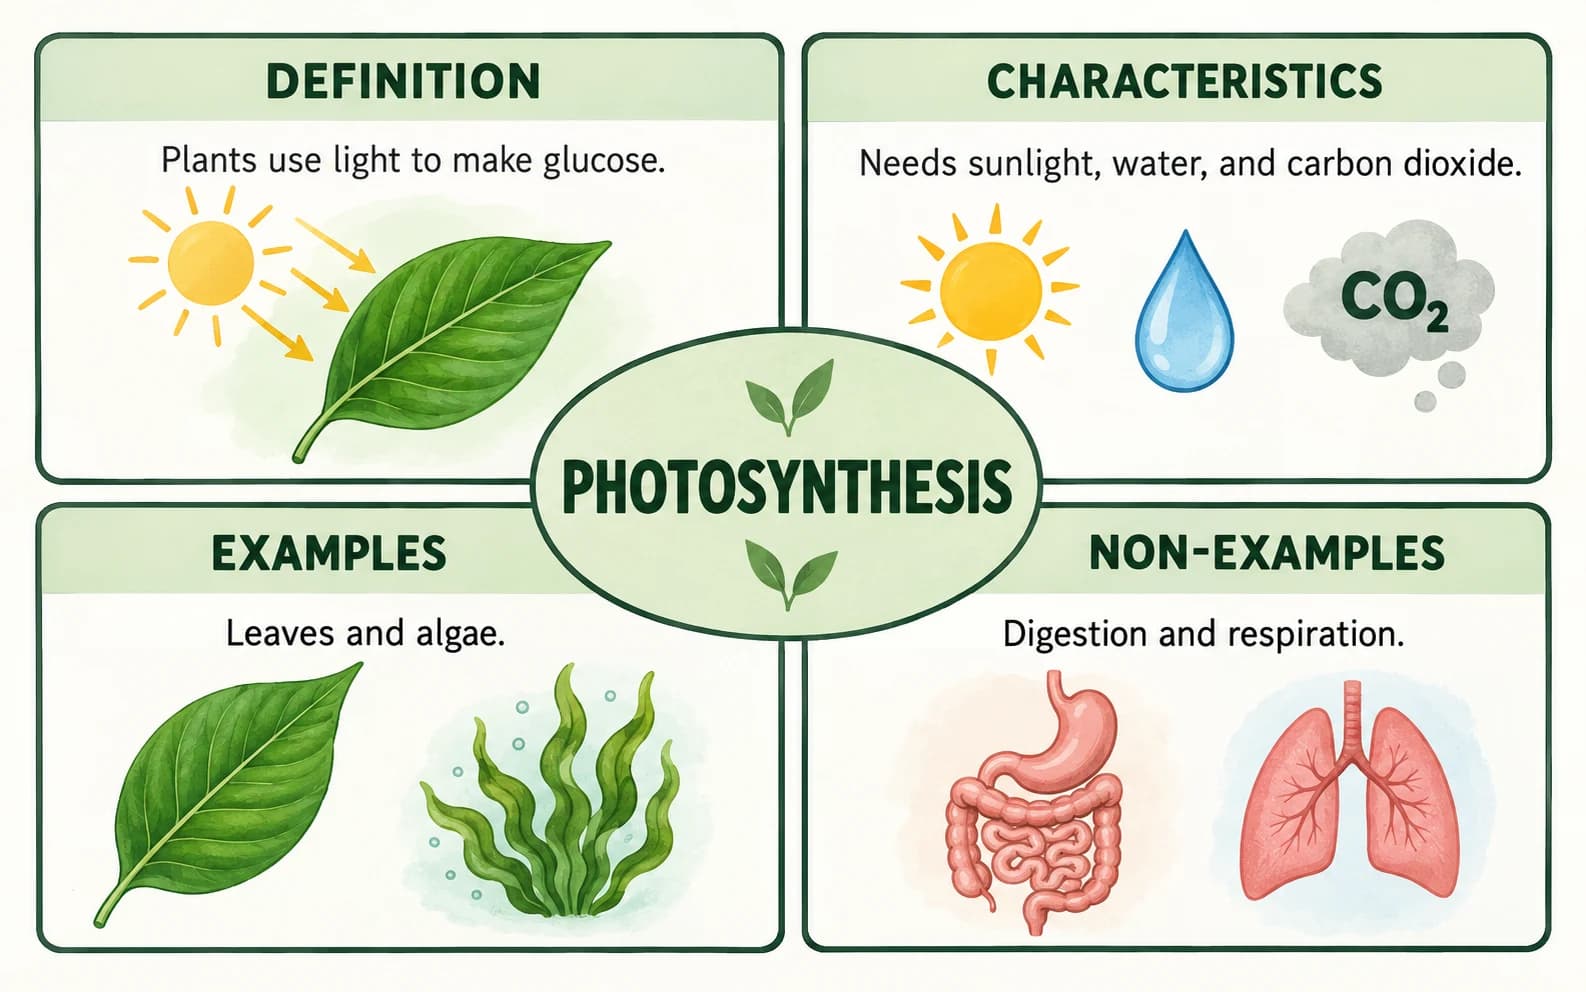
Build vocabulary depth through definitions, characteristics, examples, and non-examples.

Editable Venn diagram comparing concepts

Venn Diagram Maker

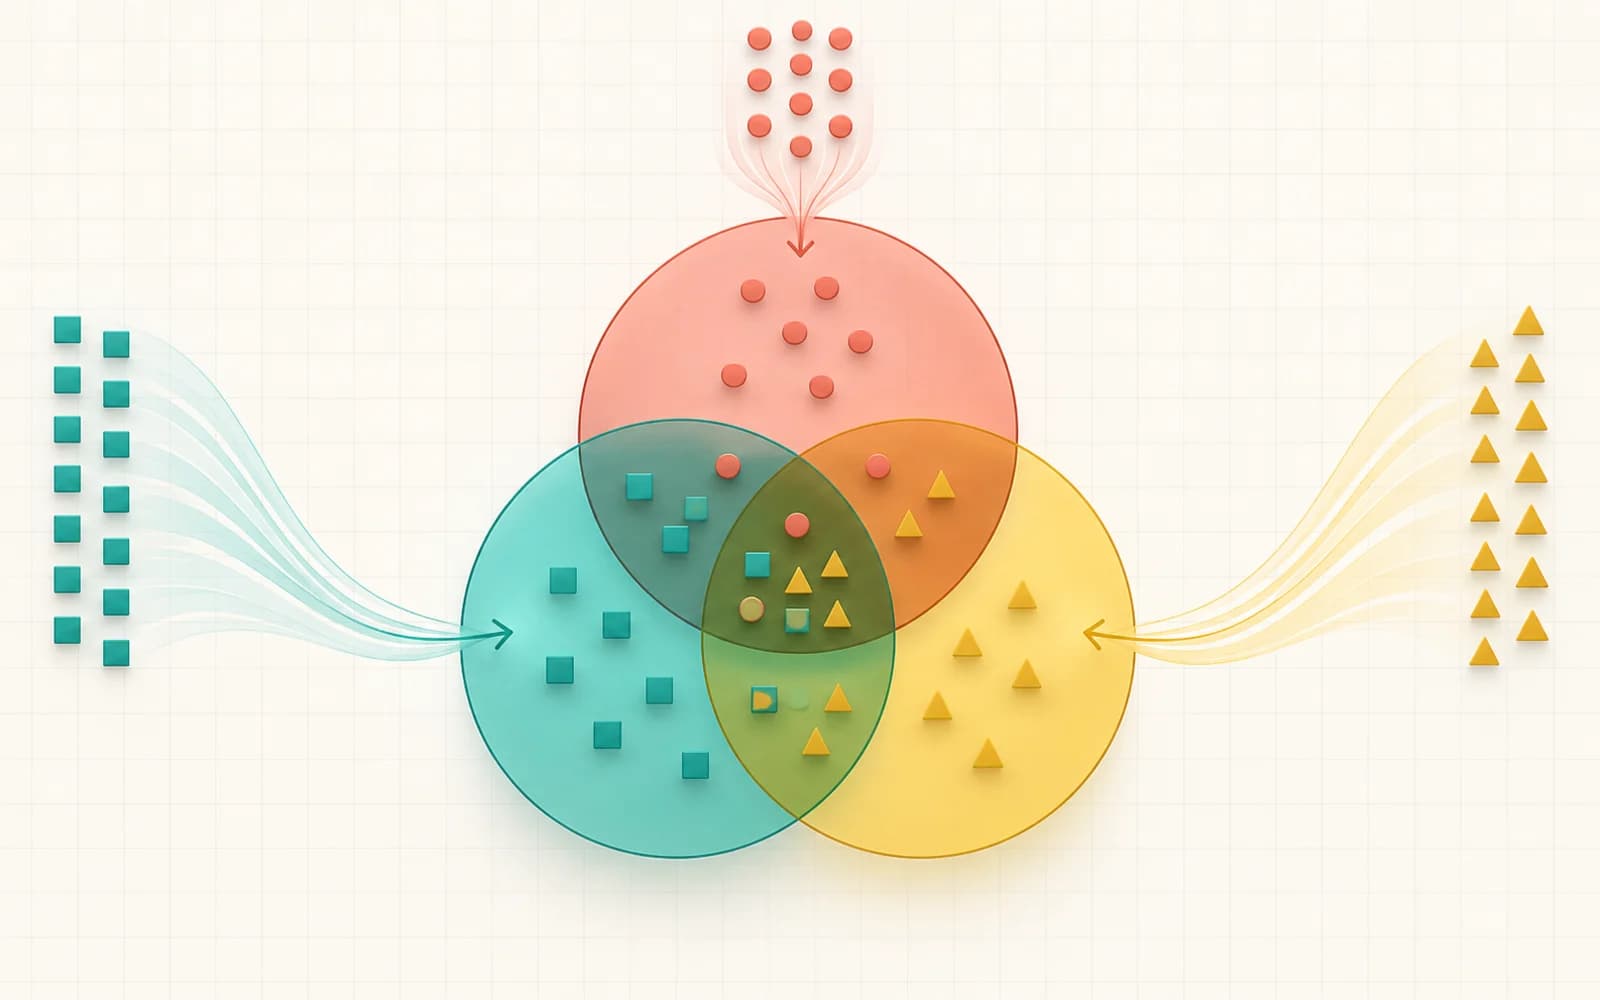
Compare concepts by mapping unique traits and shared overlaps.

Cause and effect FAQ

Cause and Effect Graphic Organizer Questions

What is a cause and effect graphic organizer?+

A cause and effect graphic organizer is a visual tool that connects reasons or conditions to the events and results they produce. Boxes hold specific ideas, while arrows show the direction of the relationship. It can display one cause and one effect, several causes feeding one event, several effects following one event, or a linked event chain.

Which graphic organizer is best for cause and effect?+

Use a branching cause-and-effect map when several causes contribute to one event or one event creates several results. Use an event chain when each effect becomes the cause of the next step. A fishbone diagram is useful for investigating categories of possible root causes, but it is less direct for a simple classroom explanation.

What are examples of cause and effect?+

Solar energy heating surface water causes evaporation, and cooling water vapor causes condensation. That science example works as an event chain because each result helps produce the next stage. In history, several policies and protests may contribute to one central event, while that event can lead to several political or social outcomes.

How do I make a cause and effect organizer online?+

Choose the branching map or event-chain layout. Enter a worksheet title and add concise causes, the central event, and effects—or add each chain step in order. For deeper reasoning, turn on Evidence + mechanism and explain why each arrow is justified. Select a filled or blank version, choose the print palette, then download SVG, PNG, or PDF.

Can I create a blank printable cause and effect worksheet?+

A blank printable cause and effect worksheet takes the same layout as your filled model. Enter a title, choose the structure and number of boxes, then select Blank worksheet. The preview replaces statements with writing lines while preserving arrows and labels. Choose black and white for photocopying, then use Print / Save PDF.

What is the difference between sequence and cause and effect?+

Sequence only tells the order in which events occur. Cause and effect explains why one event produces another. Events can happen one after another without being causally connected, so learners should support each arrow with evidence or a clear mechanism rather than relying on chronology alone.

How do I add evidence or a causal mechanism to the organizer?+

Choose Evidence + mechanism under Reasoning depth. A second field appears beneath every cause, effect, or event-chain step. Use it to explain the process that connects the ideas or cite a supporting detail from the source. These notes appear in the live preview and remain in SVG, PNG, and printable PDF exports.

Can I export an editable cause and effect organizer?+

Download SVG for a scalable vector file that can be edited in compatible design or presentation software. Download PNG for slides, learning platforms, and documents, or use the print option to save a classroom-ready PDF. The tool does not add a watermark.

Make the relationship visible

Create a Cause and Effect Graphic Organizer Now

Turn evidence into a clear map, document why each causal link holds, then export a filled model or blank worksheet learners can actually use.

Use the Cause and Effect Maker