Turn research data into plots, heatmaps, survival curves, and phylogenetic trees.
Use scatter plots for relationships and dot or box plots for distributions. Forest and funnel plots support evidence synthesis; survival curves, heatmaps, volcano plots, and phylogenetic trees suit time-to-event, matrix, expression, and evolutionary data.
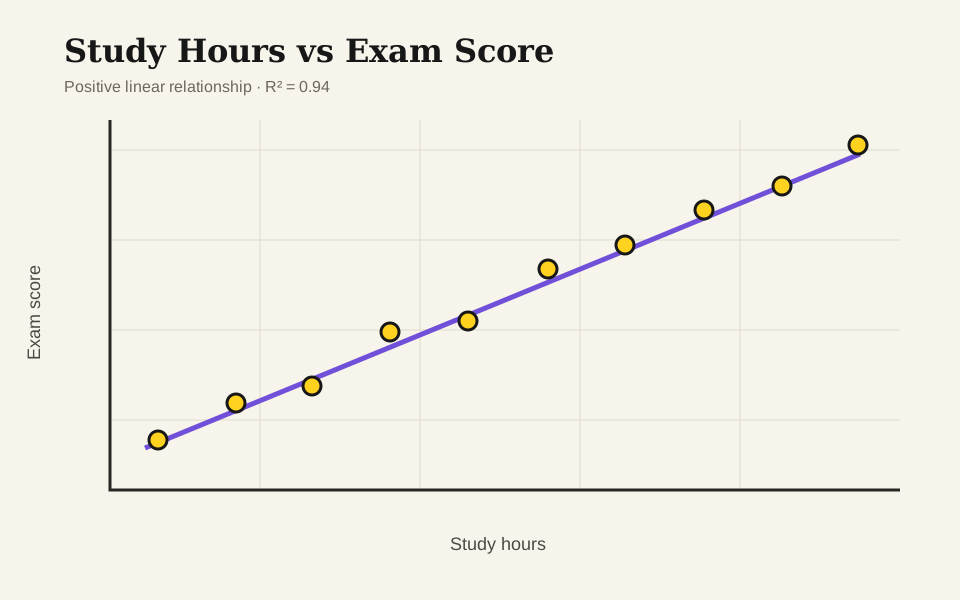
Paste X-Y data, fit a line of best fit, check R² and outlier impact, then export SVG or PNG.
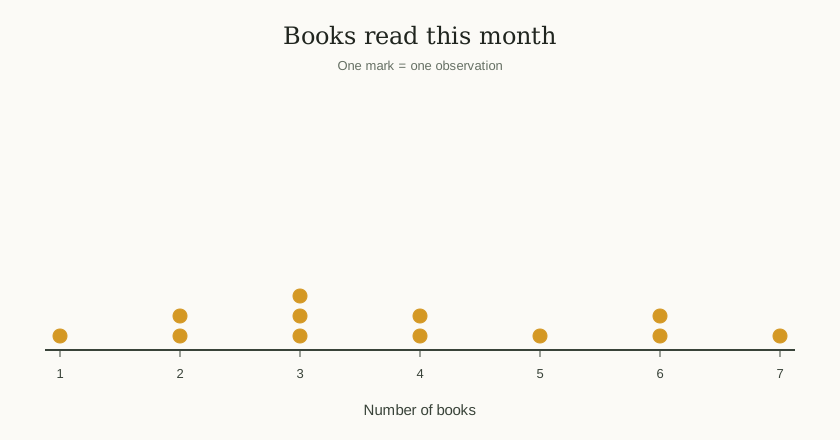
Paste numeric values, stack repeats, and export a dot plot as SVG or PNG.
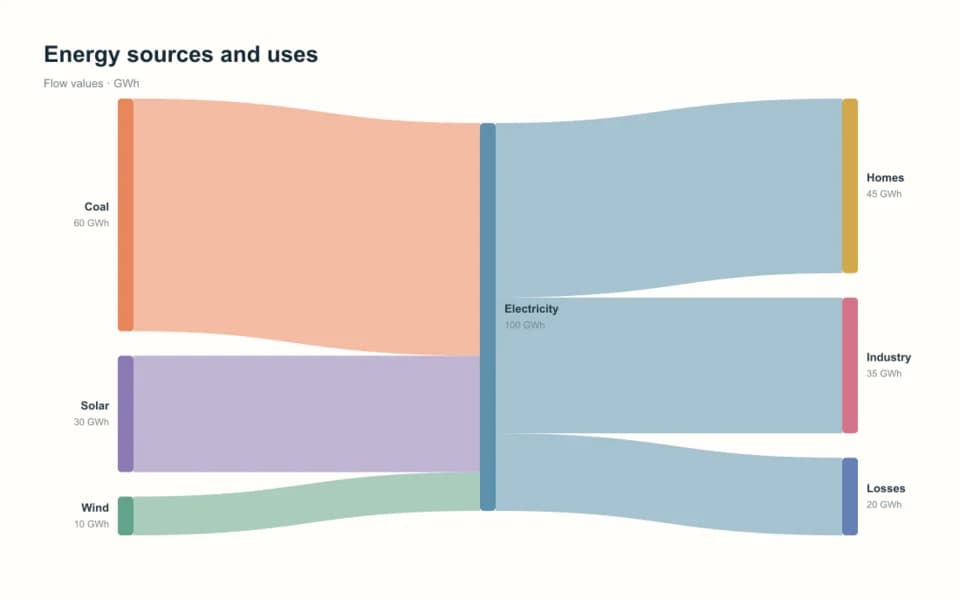
Paste source-target-value data, check flow balance, and export a Sankey diagram as SVG or PNG.
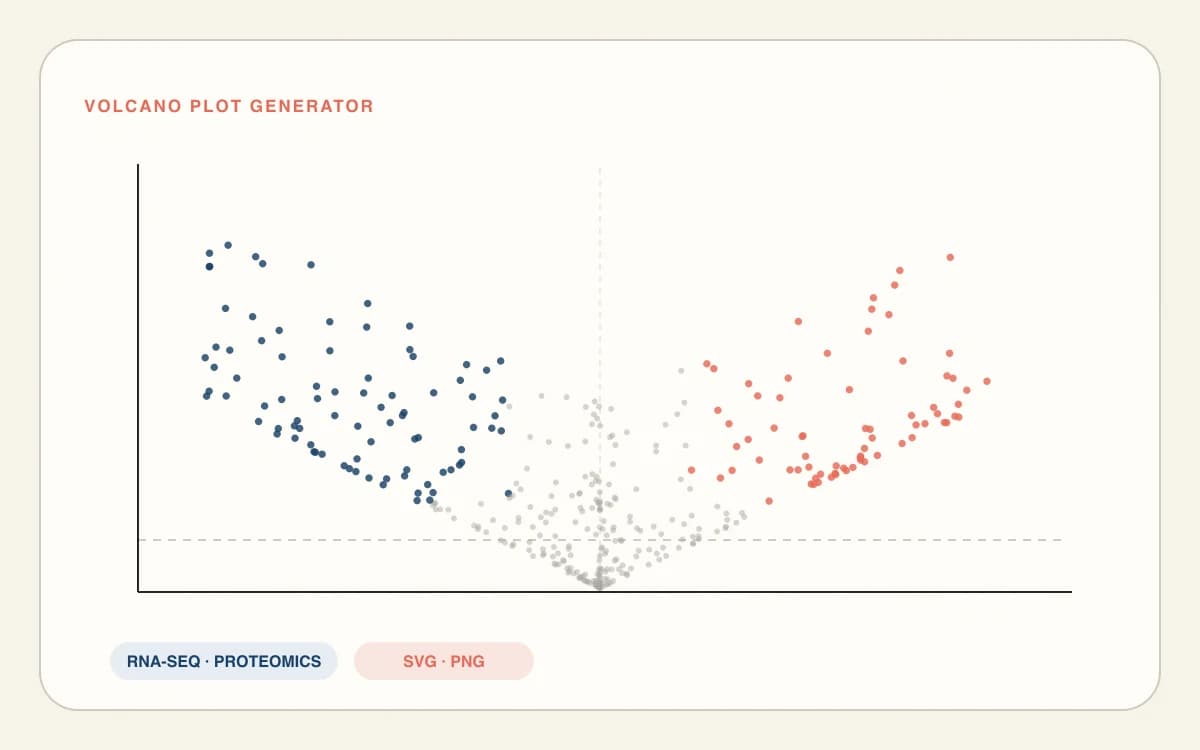
Paste differential-expression data, check the mapped columns, adjust thresholds, and export SVG or PNG.
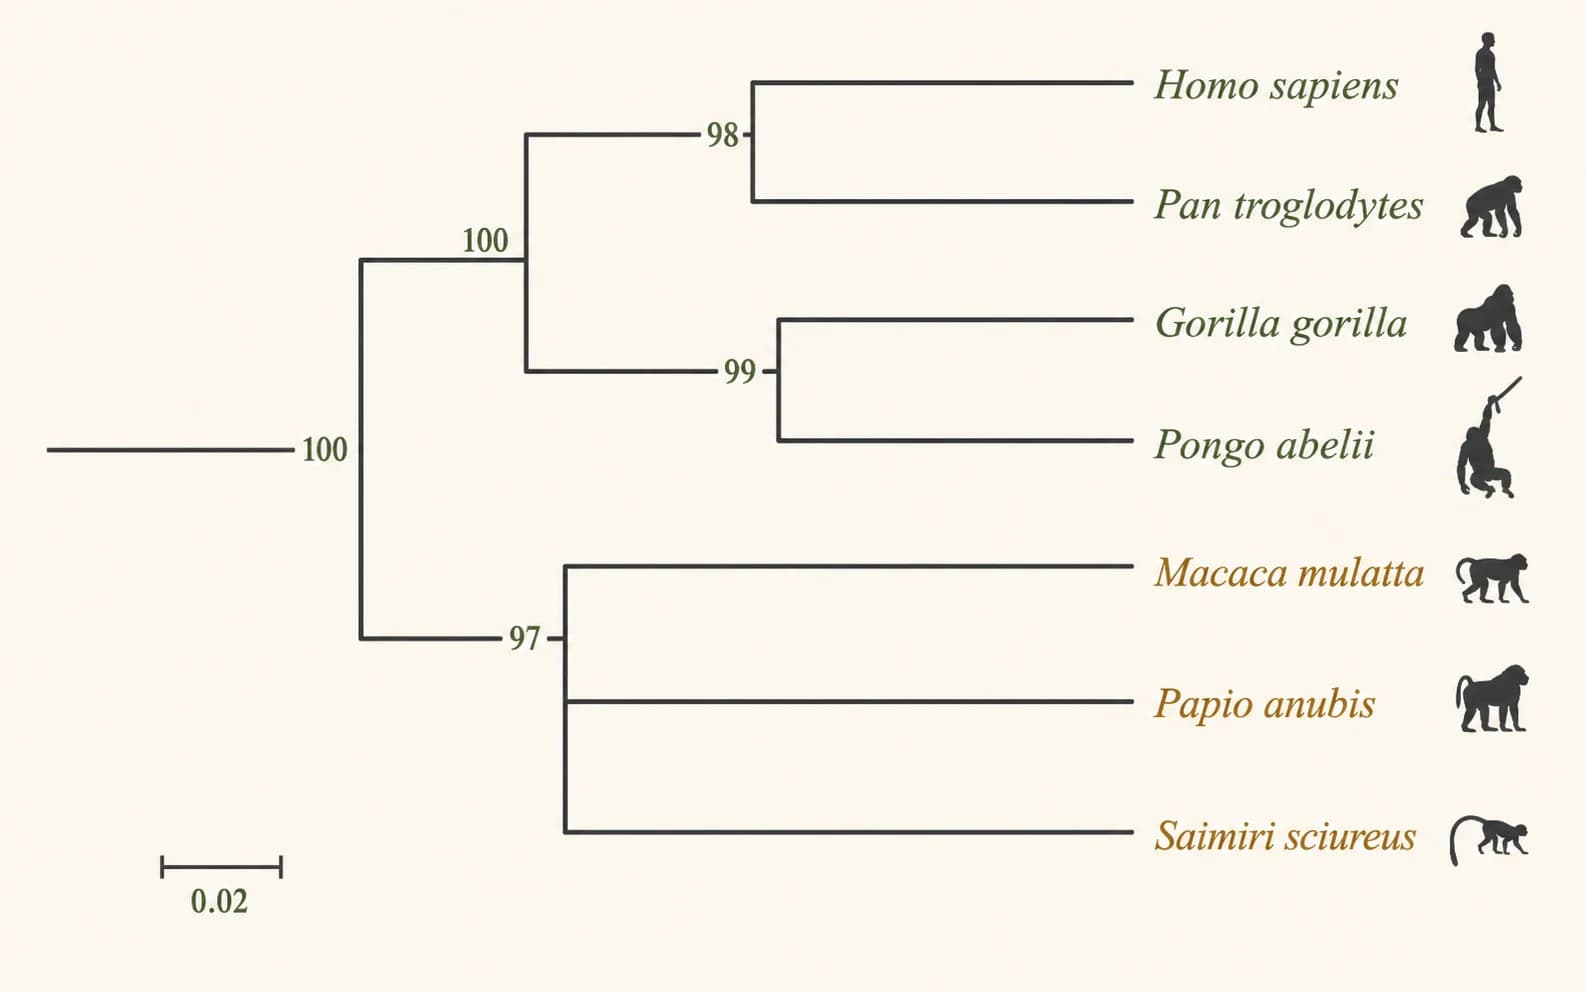
Paste Newick, a species list, or aligned FASTA to generate and export an editable phylogenetic tree.
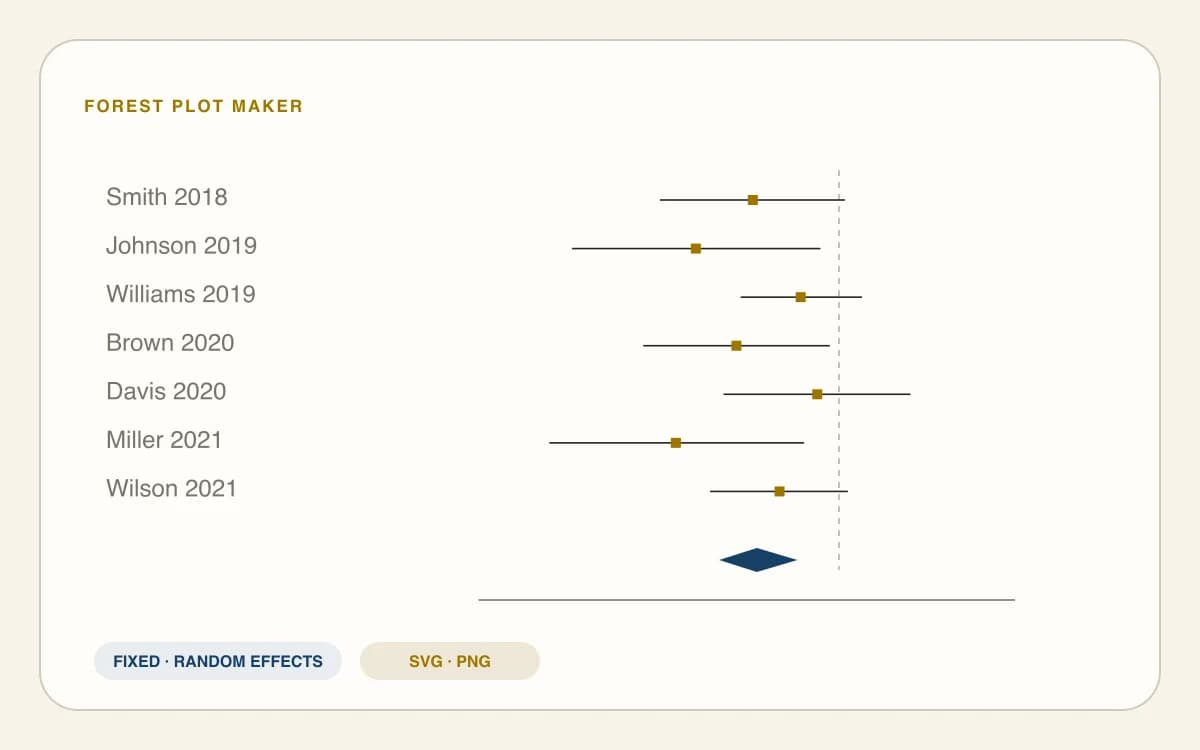
Paste study effects and confidence intervals, compare fixed or random effects, and export SVG or PNG.
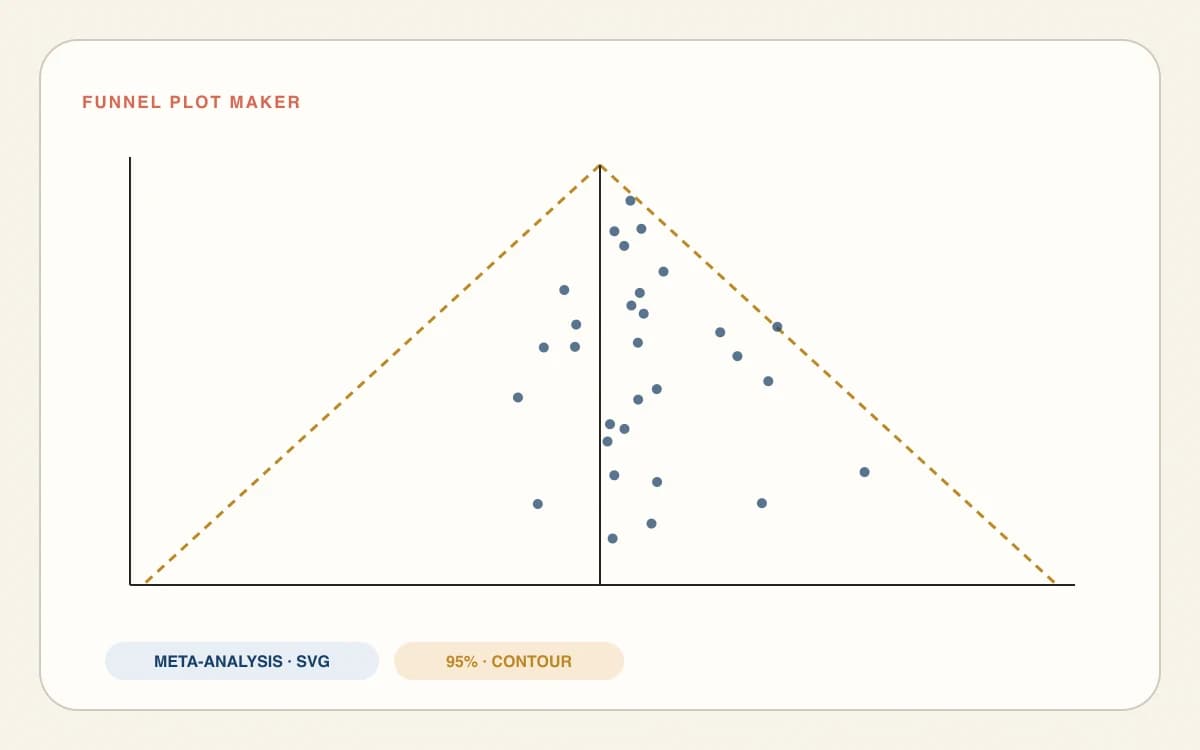
Paste study effects and precision data, assess asymmetry, and export SVG, PNG, or JSON.
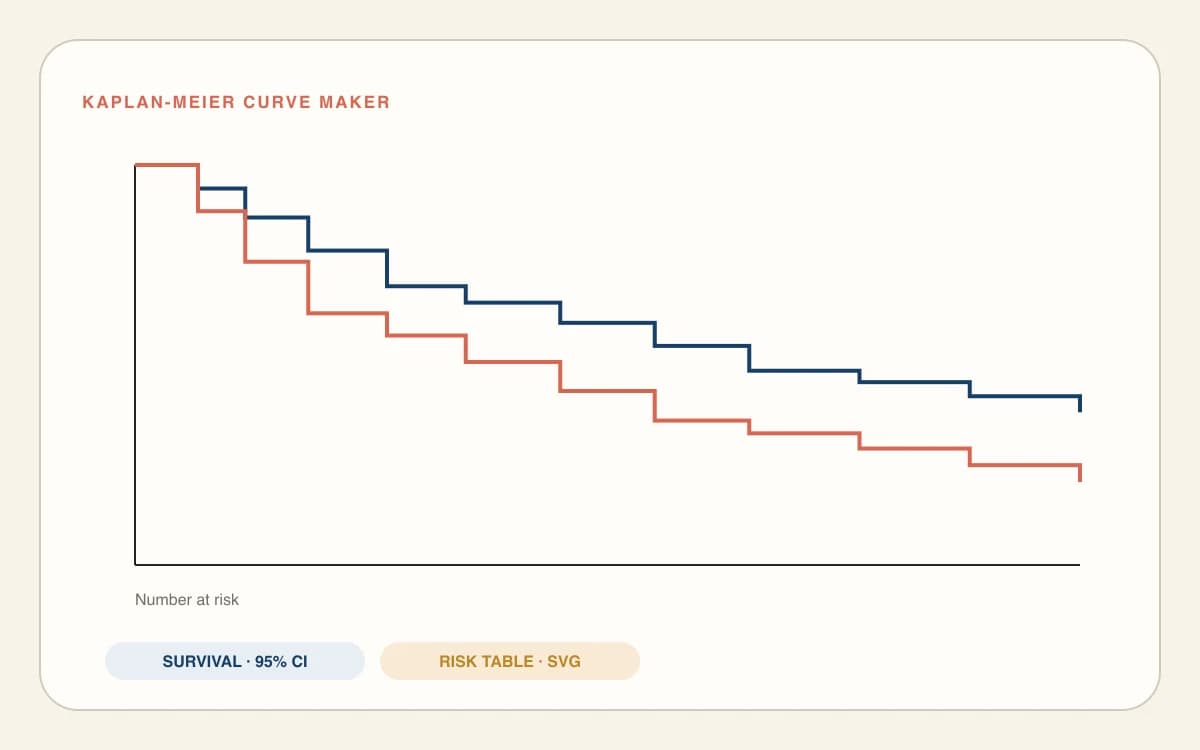
Paste time-to-event data, confirm censoring, add a risk table and log-rank test, and export SVG or PNG.
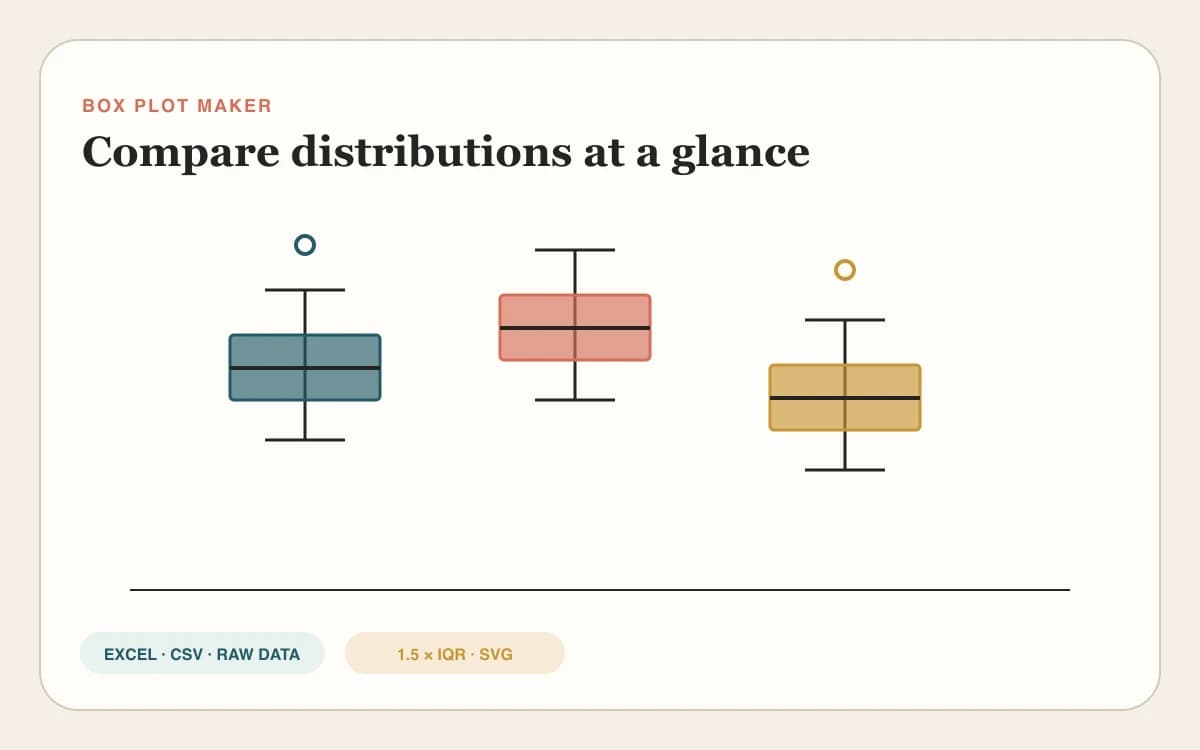
Paste raw values from Excel or CSV, compare groups, detect 1.5×IQR outliers, and export SVG, PNG, or summary CSV.

Paste an Excel or CSV matrix, normalize and cluster rows or columns, add dendrograms, and export SVG, PNG, or ordered CSV.


