Free Volcano Plot Generator for RNA-seq & Proteomics
Paste differential-expression data, check the log₂ fold-change and significance columns, adjust thresholds and gene labels, then export an editable SVG or high-resolution PNG. Your data stays in your browser.
CSV, TSV or paste from ExcelAutomatic column mappingLive threshold and label controlsEditable SVG and PNG export
Differential-expression data
Paste CSV or TSV, copy from Excel or upload a text file. Common column names are mapped automatically.
sample-rna-seq.tsv
Your table stays in your browser. Opening the editor creates an editable project in your account.
Live preview
28
Upregulated
35
Downregulated
57
Not significant
Points are calculated from your values. Review the detected columns and thresholds against the analysis plan before submission.
Need a scientific illustration for your paper?
Turn your research methods, mechanisms, and workflows into clear figures with paper banana.
Volcano plot basics
What Is a Volcano Plot and What Data Does It Show?
A volcano plot is a scatter plot that combines effect size and statistical significance. The horizontal axis shows log₂ fold change. The vertical axis shows −log₁₀ p-value, adjusted p-value, FDR, or q-value. Features in the upper-left and upper-right corners have both a large change and strong statistical evidence.
Researchers use volcano plots to scan thousands of genes, proteins, metabolites, or screening features at once. A clear plot separates significantly upregulated, significantly downregulated, and non-significant features, then labels only the candidates that need attention.
This tool calculates every point from your table. It checks the mapped columns and invalid rows before drawing, so a polished figure cannot hide a broken p-value scale or missing fold-change values.
01
Feature identifier
Gene symbol, protein ID, metabolite, SNP, or screening feature.
02
Effect size
A log₂ fold-change column centered around zero.
03
Significance
Raw p-value, adjusted p-value, FDR, or q-value between 0 and 1.
04
Thresholds
The effect-size and significance rules used to classify hits.
Volcano Plot Examples for RNA-seq, Proteomics, and Metabolomics
Load a matching sample to inspect the data format, thresholds, labels and color groups before you replace it with your own results.
Built for real research work
Create Volcano Plots for Omics Analysis and Manuscript Revision
Go from a differential-expression table to a reviewable figure without rebuilding the analysis in a second plotting tool.
RNA-seq manuscripts and theses
Paste DESeq2, edgeR, or limma output, verify the mapped columns, and label the genes discussed in the results section.
Proteomics and metabolomics screens
Handle protein or metabolite identifiers, adjusted significance, and domain-specific sample tables without rewriting code.
Coauthor and reviewer revisions
Change a cutoff, add a requested label, or switch the palette while keeping the data and plot settings together.
What you can control
Validate Differential-Expression Data Before Plotting
Column mapping, invalid-row checks, thresholds, labels, statistics and export stay in one visible workflow.
Map DESeq2, edgeR, and limma columns without renaming them
Recognizes gene, symbol, feature, protein, log2FoldChange, logFC, pvalue, padj, FDR and qvalue headers. The detected mapping stays visible so you can check it before export.
Export an editable SVG with reproducible plot settings
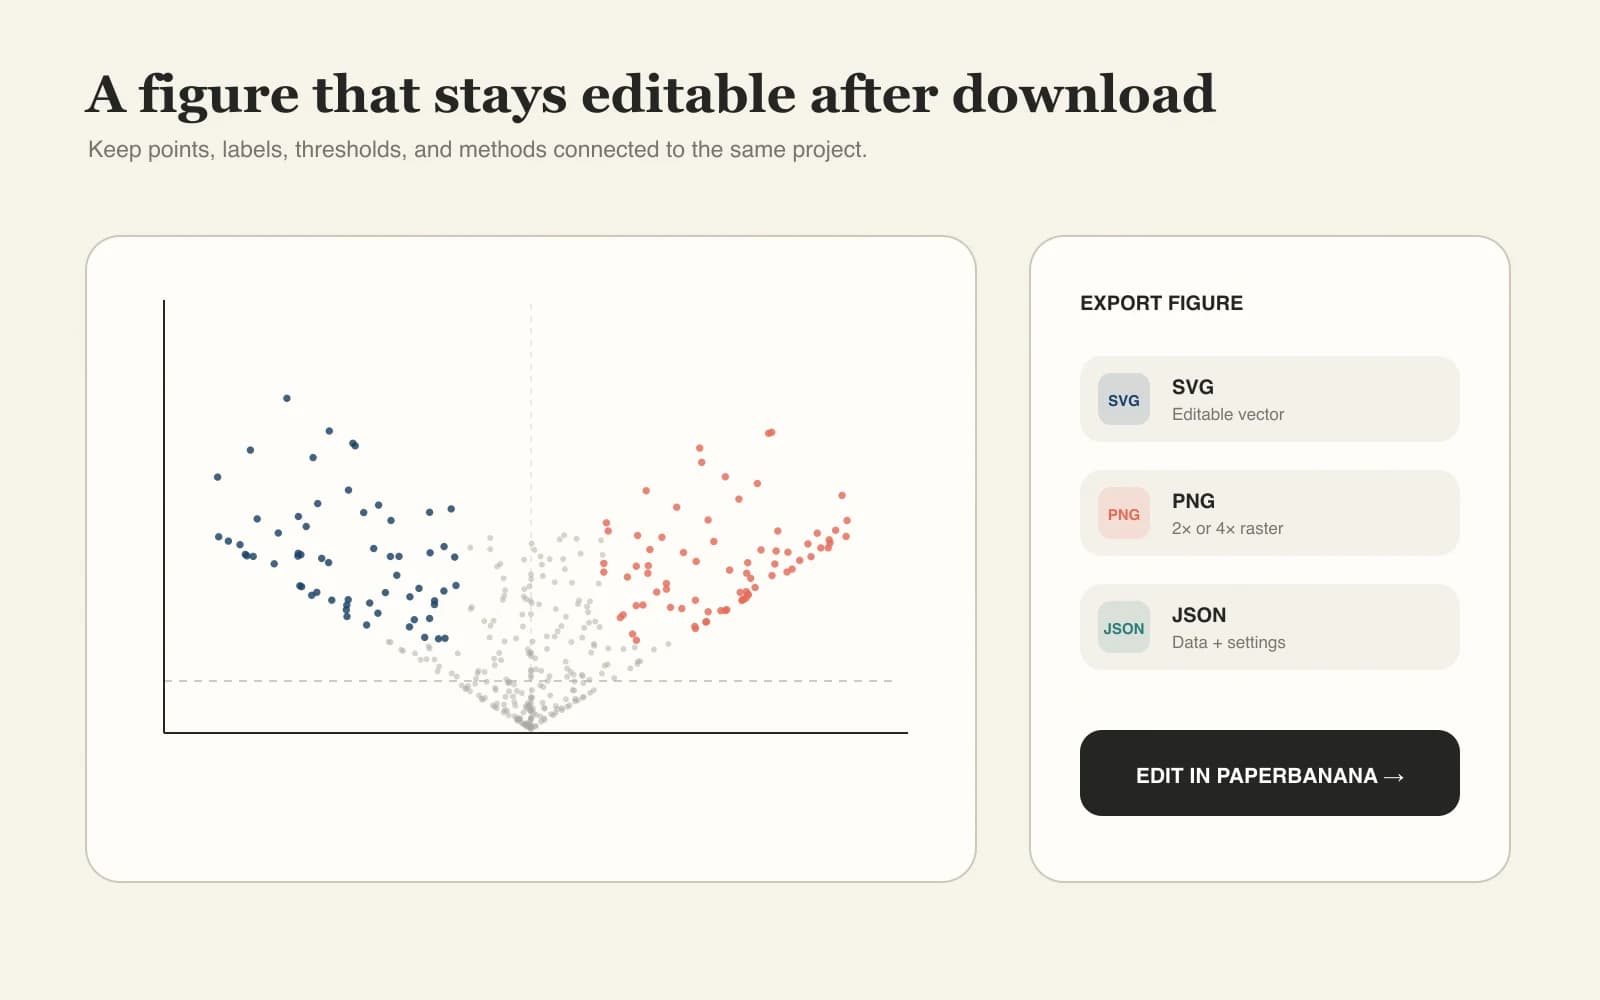
Download SVG for vector editing, PNG for documents and slides, or JSON with the table and settings. Open the SVG in PaperBanana for final label and layout edits.
Check log₂FC, P-Values, padj, and FDR Before Export
A volcano shape can still be wrong if the columns use the wrong scale or contain invalid values. The tool checks the input and reports what it excluded, without silently changing your results.
Verify the effect-size column
The X-axis must use numeric log₂ fold-change values. Linear fold change needs conversion before plotting.
Verify p-values and adjusted significance
The significance column must contain values greater than 0 and no greater than 1. Zero, negative, missing, and non-numeric values are reported.
Keep invalid rows out of the figure
The preview counts valid and invalid rows separately, so missing data cannot disappear unnoticed.
Column mapping and invalid-row counts stay visible before SVG, PNG, or JSON export.Data checked
Why researchers use it
Make a Publication-Ready Volcano Plot Without R or Python
Stay focused on interpretation while the tool handles plotting, readable labels and export.
No code
Skip plotting-package setup
Create the figure without installing R, Python, ggplot2, Plotly or EnhancedVolcano.
Auto-map
Map familiar column names
Start from outputs you already have instead of renaming every column to a fixed three-column template.
Auditable
Keep statistical groups visible
See exactly how many features are upregulated, downregulated, non-significant, or invalid.
Readable
Label only the strongest hits
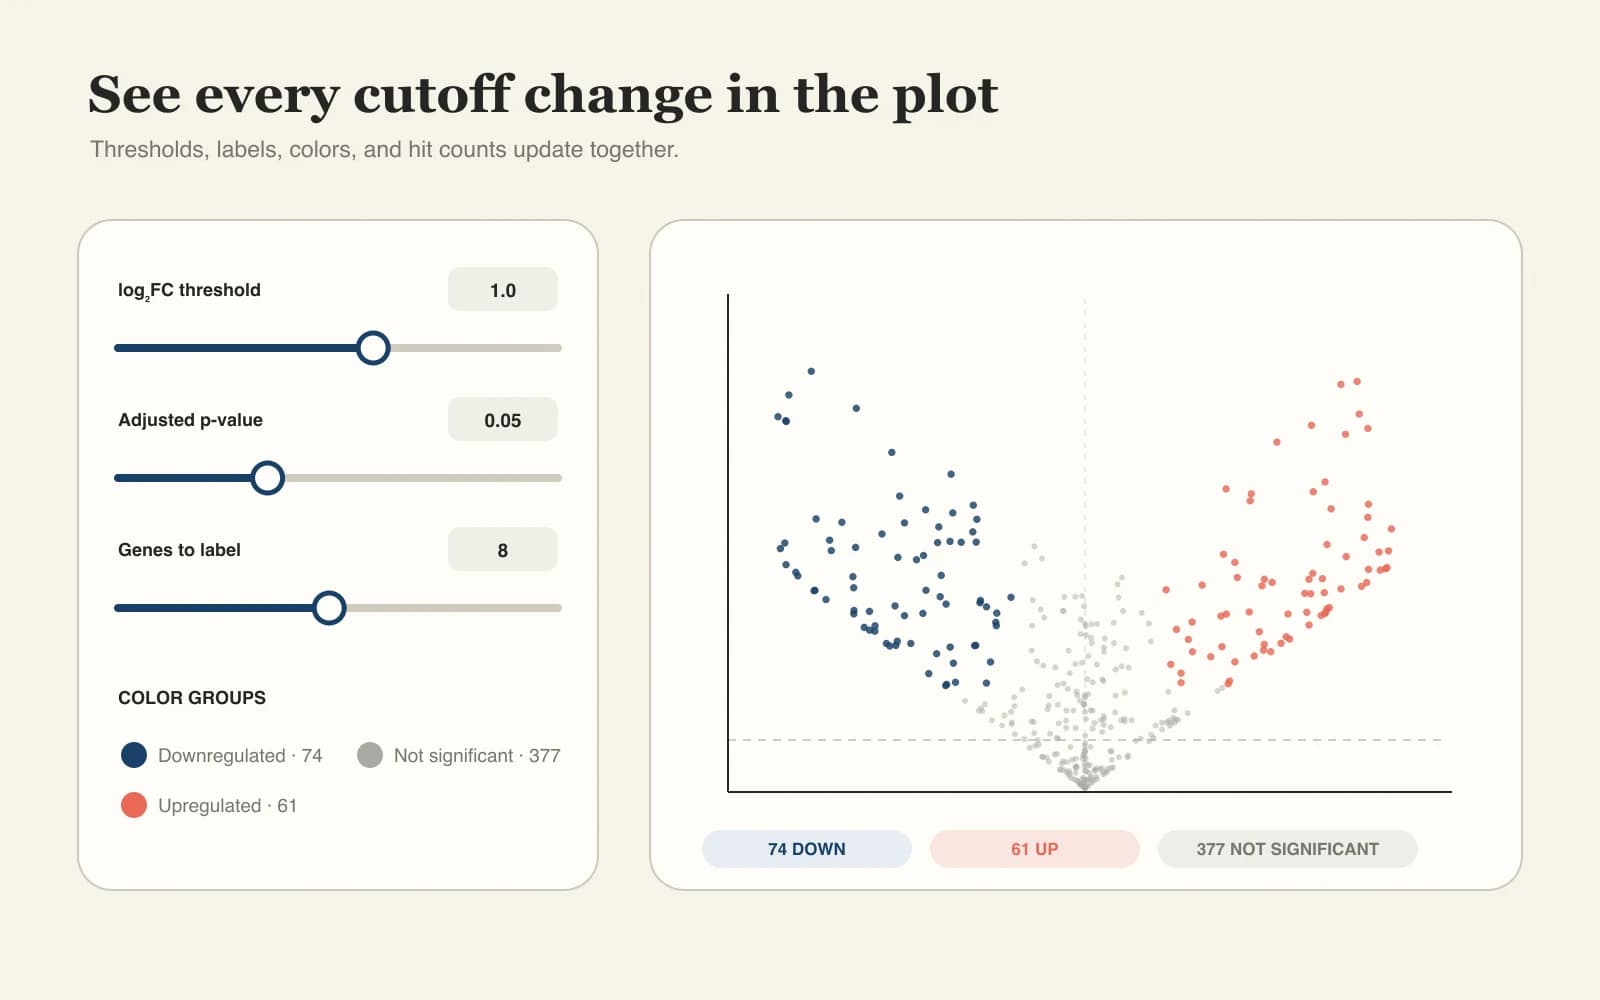
Reduce clutter by labeling a controlled number of features ranked by effect size and significance.
SVG
Preserve vector quality
Export SVG when a journal, poster, or coauthor needs scalable text and editable points.
Private
Keep research data local
Pasted and uploaded data stays in your browser unless you choose to open an editable project.
Four-step workflow
How to Make a Volcano Plot Online in Four Steps
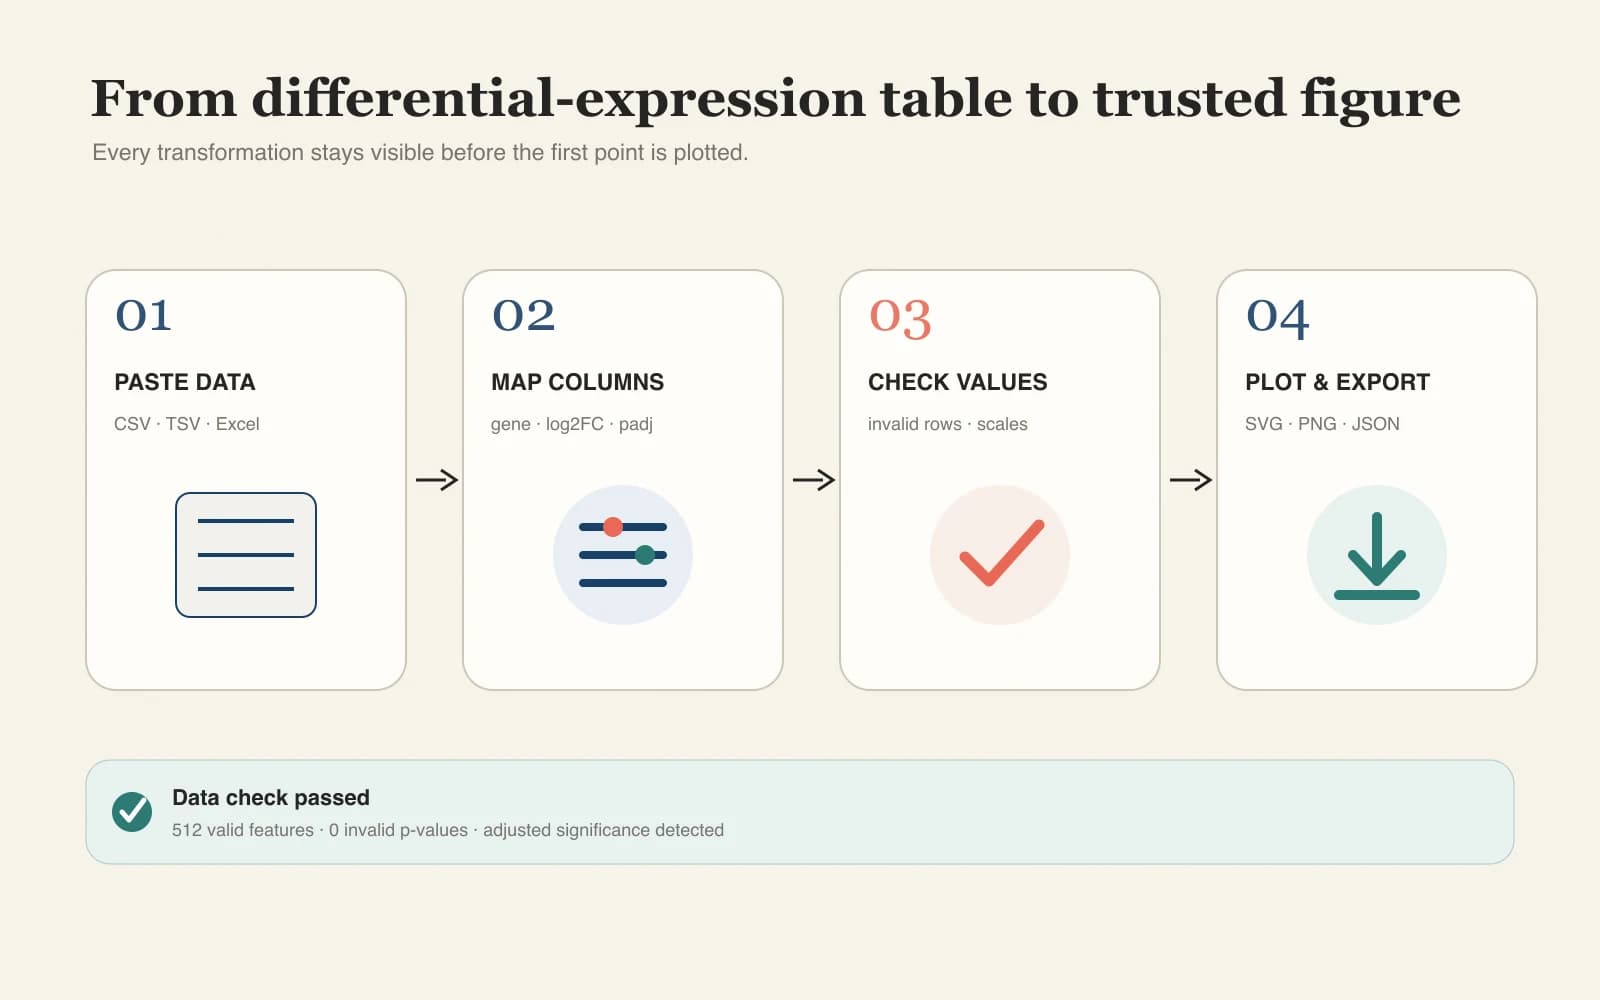
Prepare the table, check the detected columns, adjust the cutoffs and export the figure.
01
Paste a table or upload a file
Use CSV, TSV, TXT or rows copied from Excel. Include a feature name, a log₂ fold change and a significance column.
02
Review the detected column mapping
Confirm which headers will become the feature labels, X-axis values, and significance values.
03
Set thresholds and gene labels
Choose the absolute log₂FC cutoff, p-value or adjusted-significance cutoff, and how many top hits to label.
04
Download or keep editing
Export SVG, PNG or JSON. Open the SVG in PaperBanana if the manuscript needs final typography or annotation changes.
Volcano Plot Questions About Data, Thresholds, and Export
What data columns do I need for a volcano plot?+
A volcano plot needs one feature identifier, one numeric log₂ fold-change column, and one significance column containing a p-value, adjusted p-value, FDR, or q-value. The generator detects common headers including gene, symbol, protein, log2FoldChange, logFC, pvalue, padj, FDR, and qvalue, then displays the mapping for review.
Should I use a raw p-value, adjusted p-value, or FDR?+
Adjusted p-values or FDR are generally more defensible for high-throughput experiments because thousands of features are tested simultaneously. Use the significance measure produced by the statistical analysis, keep its original meaning, and identify it in the axis label, figure caption, or methods section so readers can interpret the cutoff correctly.
How do I calculate log2 fold change and p-values?+
Calculate log₂ fold change and p-values with an appropriate differential-expression or statistical workflow before plotting. DESeq2, edgeR, and limma can produce these columns for sequencing data, while proteomics pipelines provide comparable effect-size and significance fields. The Volcano Plot Generator visualizes those results; it does not replace the underlying statistical analysis.
Can I create a volcano plot from Excel without R or Python?+
Copy the feature, log₂ fold-change, and significance columns from Excel and paste them directly into the data field; tab-separated cells are detected automatically. You can also save the worksheet as CSV or TSV and upload it. The browser draws the plot without requiring R, Python, package installation, or command-line setup.
What thresholds should I use for log2FC and significance?+
A common starting point is |log₂FC| ≥ 1 with adjusted p-value or FDR ≤ 0.05, but the correct thresholds depend on experimental design, statistical power, field standards, and the prespecified analysis plan. The controls visualize the rule you enter; they do not select or validate the scientific decision for you.
Can I use this for proteomics, metabolomics, GWAS, or miRNA data?+
Volcano plots can represent any feature-level comparison that includes an effect-size column and a valid significance column. Use protein IDs, metabolites, SNPs, miRNAs, screening hits, or other identifiers in the feature field. Review domain-specific preprocessing and multiple-testing rules before interpreting the highlighted points as biological or clinical candidates.
Is the exported volcano plot suitable for publication?+
SVG export preserves vector points, text, threshold lines, and labels for later editing. PNG provides a high-resolution raster version for documents and slides. Before submission, confirm the target journal’s figure width, font size, color requirements, caption format, and accepted file types, then verify every plotted value against the source analysis.
Does my research data leave the browser?+
Pasted and uploaded tables are parsed locally in the browser, so the source data does not leave the device during plotting or download. Data is sent to PaperBanana only when you explicitly open an account feature that creates an editable project. Review institutional data-handling requirements before using any cloud editing workflow.
Ready to plot your data?
Turn Differential-Expression Data Into an Editable Volcano Plot
Paste the table, confirm the mapping, adjust the thresholds and download an editable figure. No signup needed.