A graphic organizer is a visual framework that helps learners sort information, compare ideas, build vocabulary, connect causes and effects, or plan writing. Instead of facing a blank page, students can see where each idea belongs and how it relates to the whole.
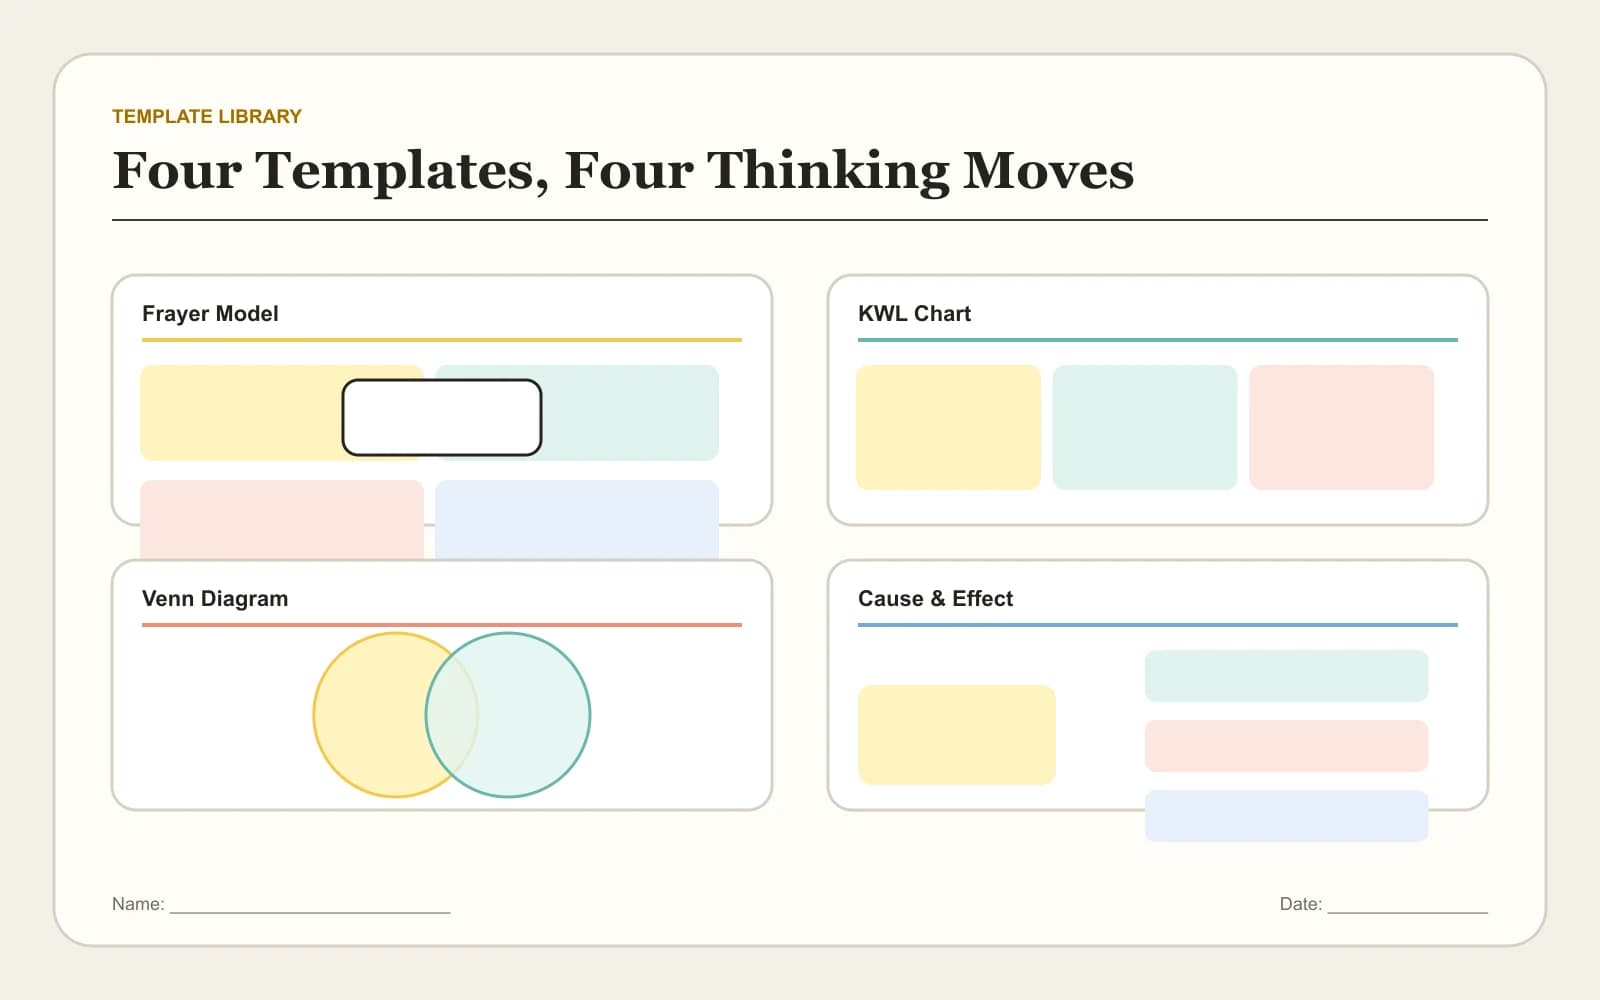
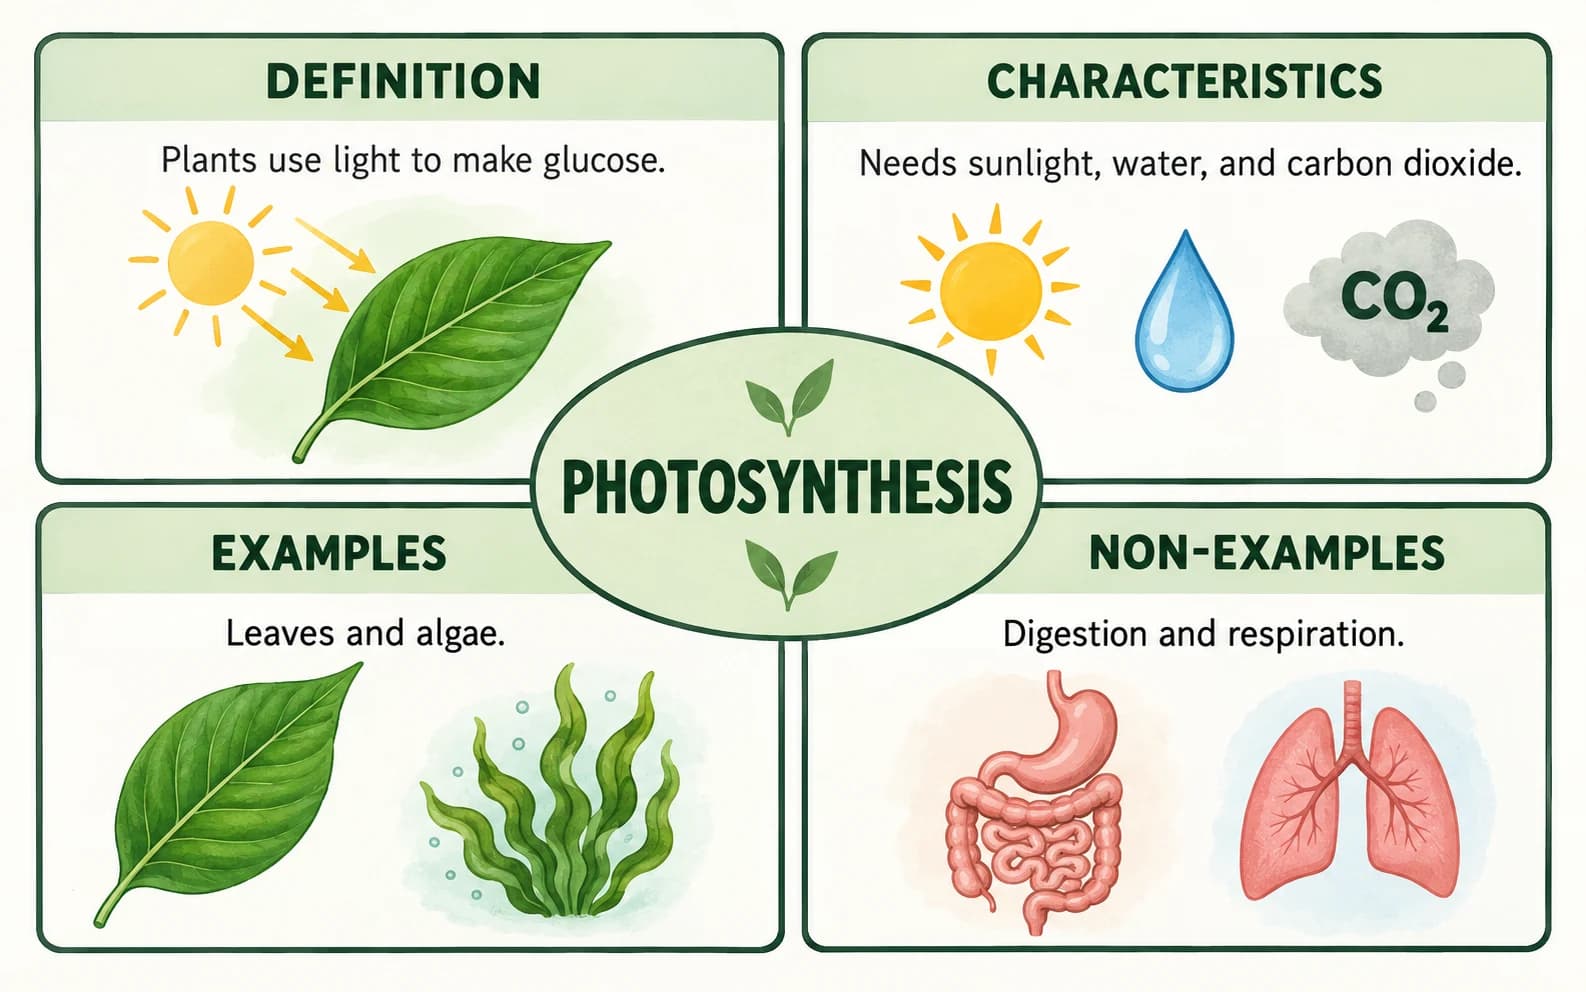
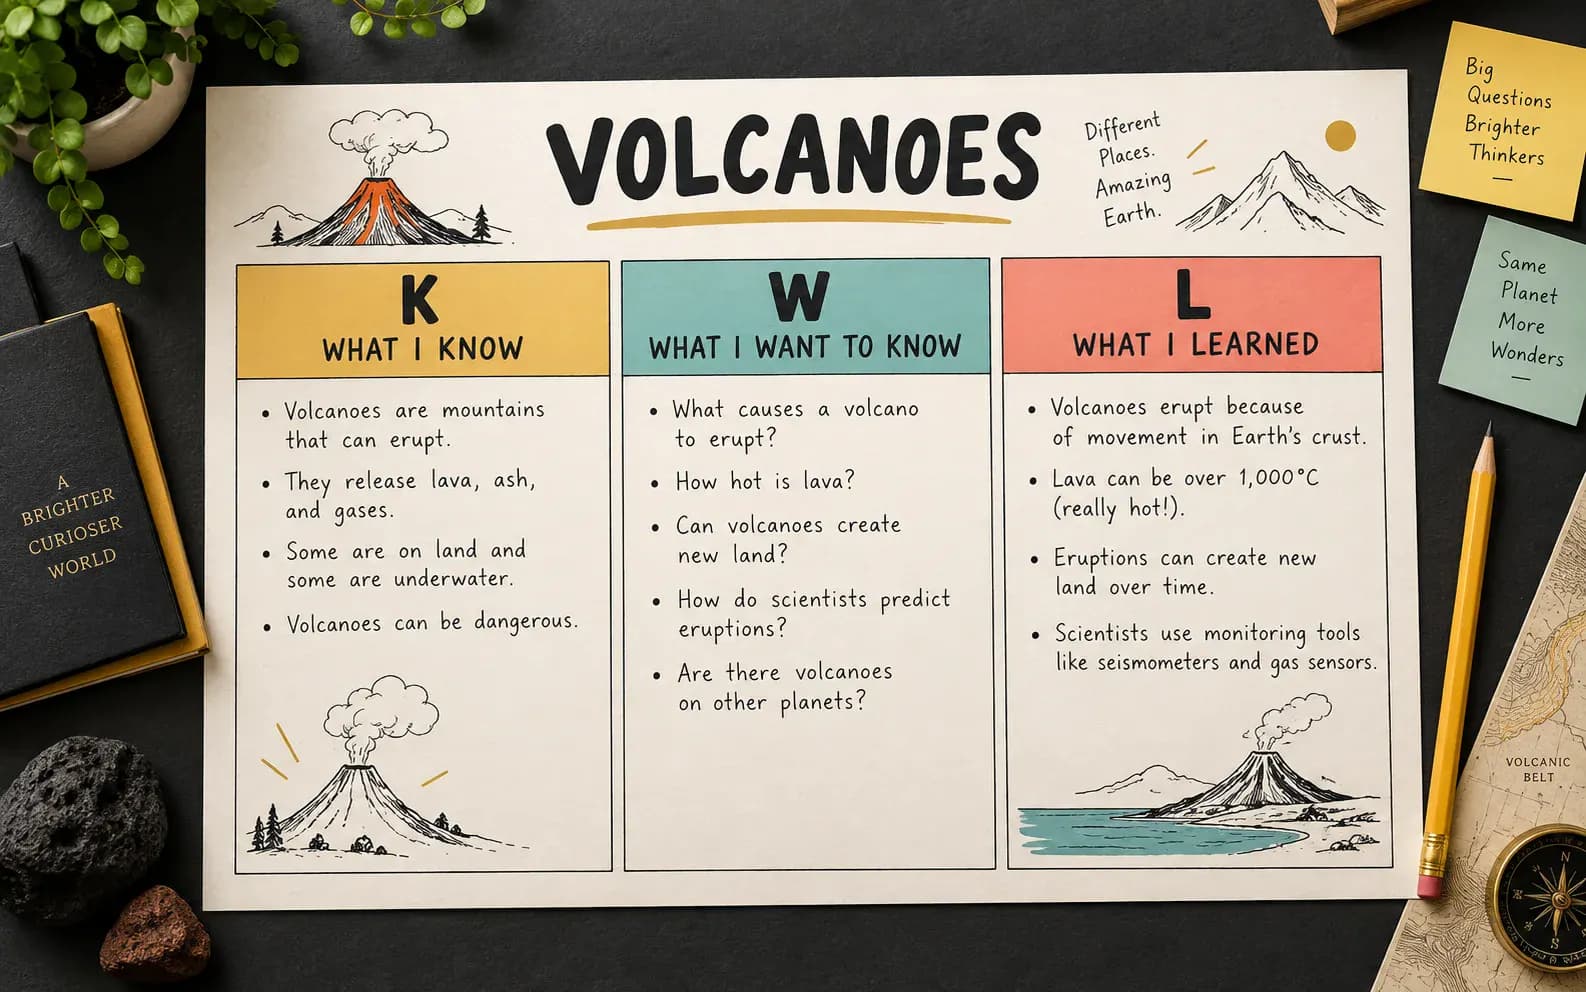
The best organizer depends on the thinking task. A Frayer model develops a concept through definition, characteristics, examples, and non-examples. A KWL chart activates prior knowledge and records learning. A Venn diagram compares two subjects, while a cause-and-effect organizer makes consequences traceable.
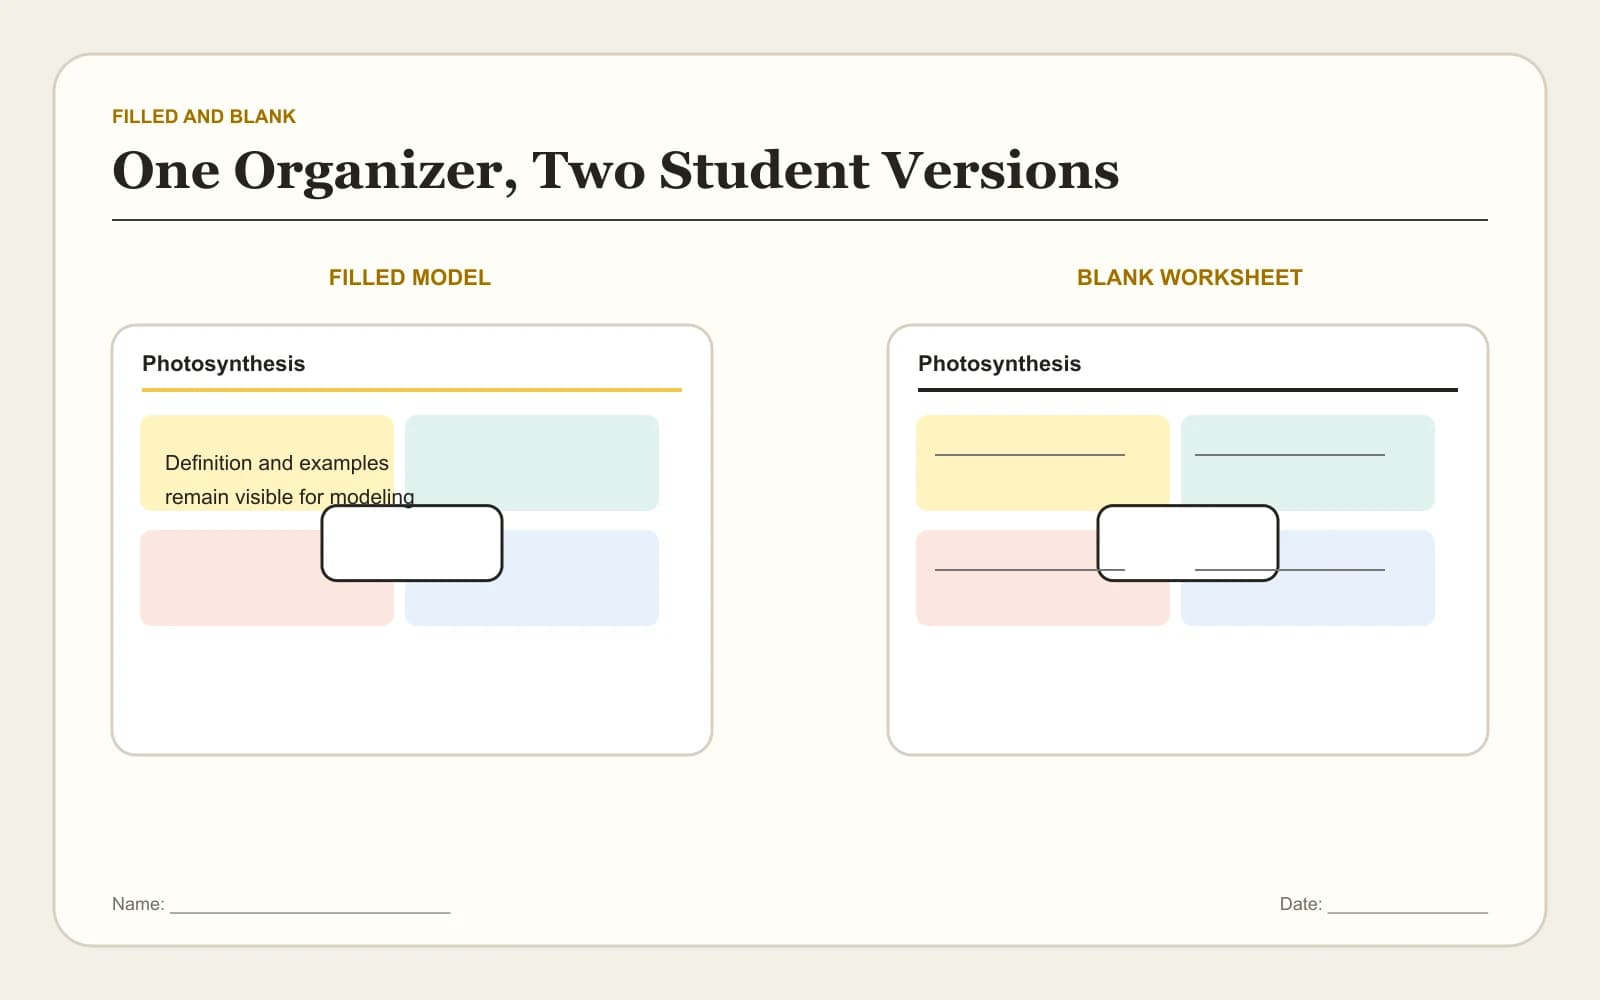
This graphic organizer maker keeps the structure fixed while every label and response stays editable. Teachers can prepare a completed model and switch to a blank student worksheet without rebuilding the page.
Activate knowledge
Surface what learners already know and what they still want to investigate.
Organize evidence
Give notes, examples, details, and observations a visible place.
Compare relationships
Show similarities, differences, causes, effects, and category boundaries.
Plan a response
Move from scattered ideas to a paragraph, discussion, project, or presentation.