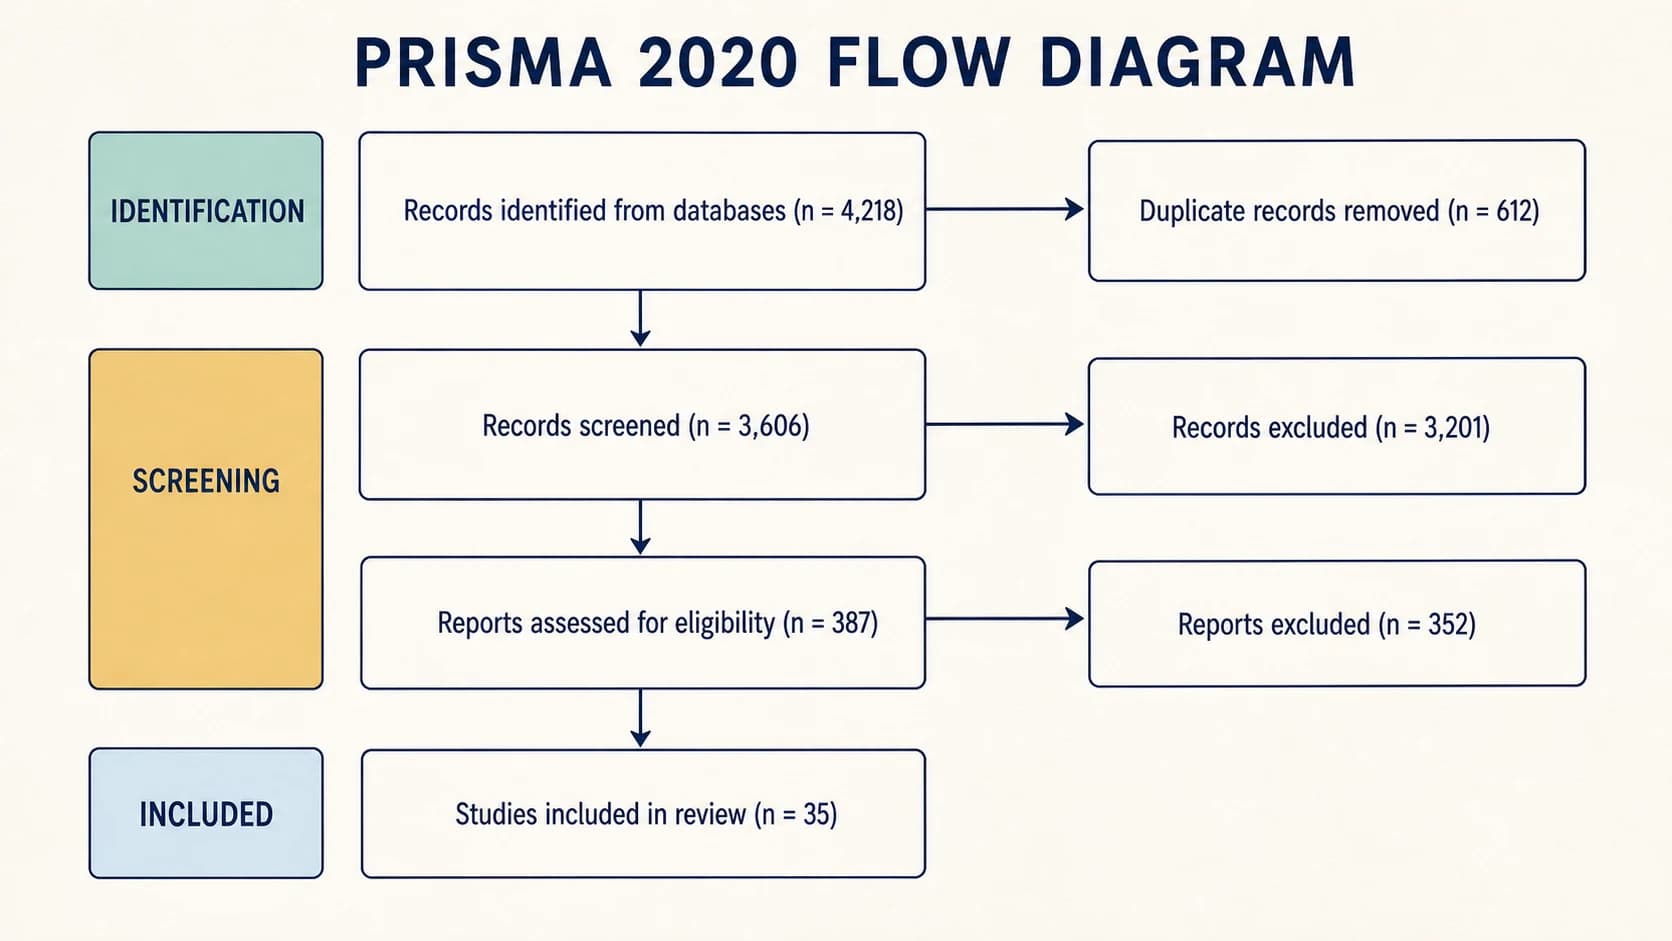
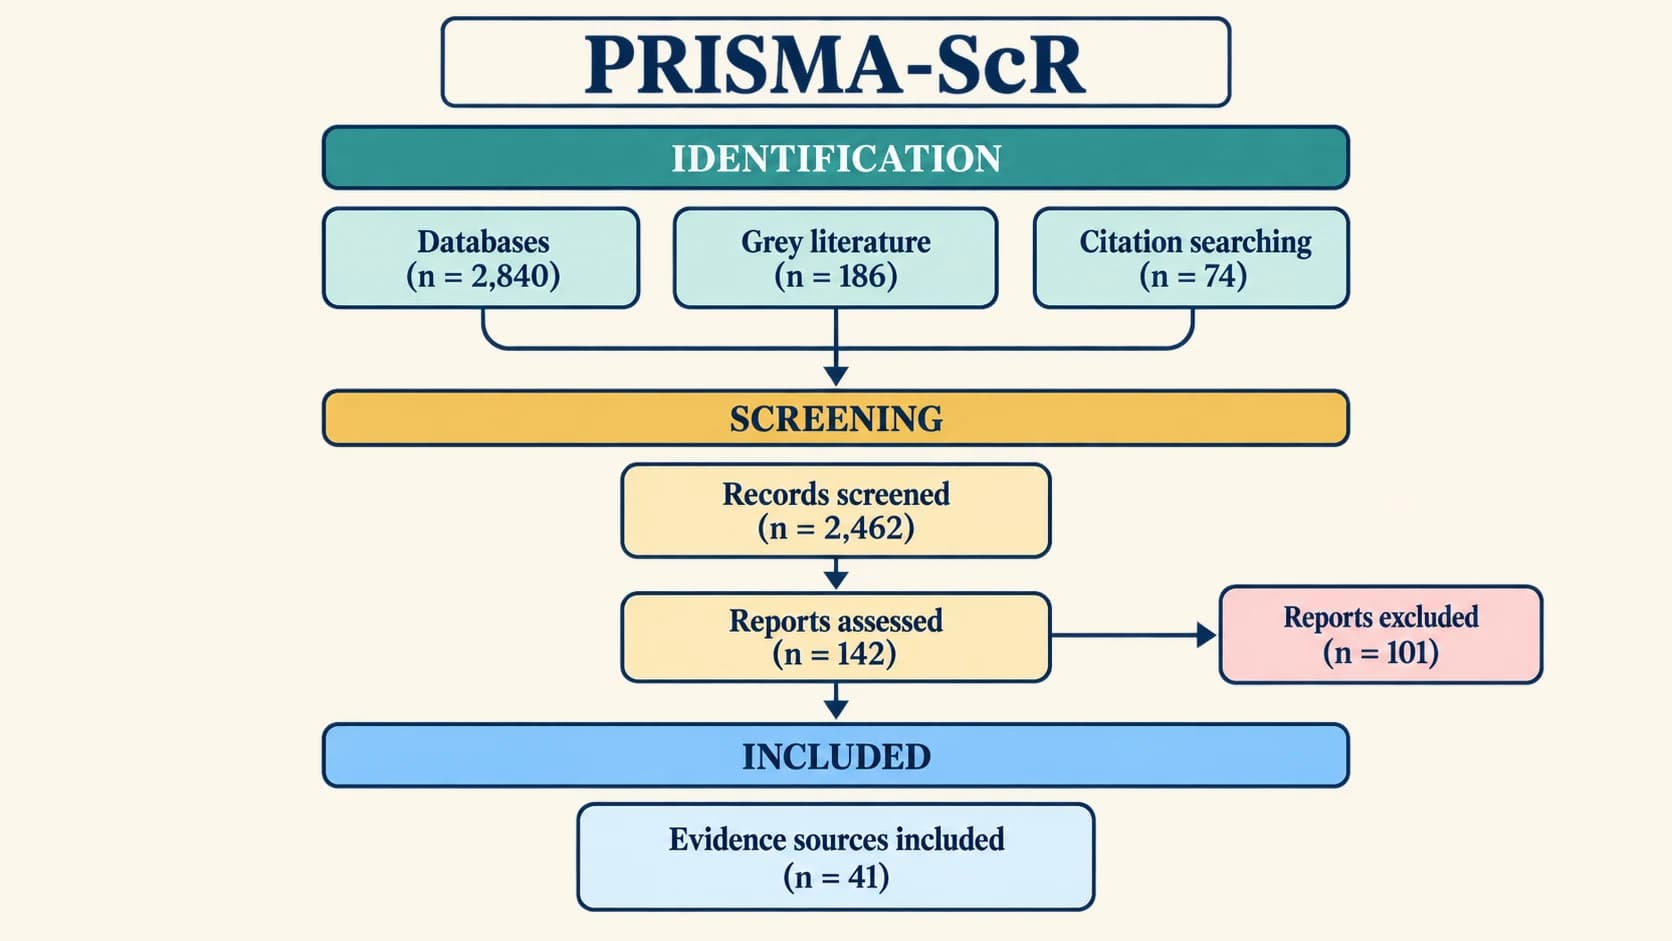
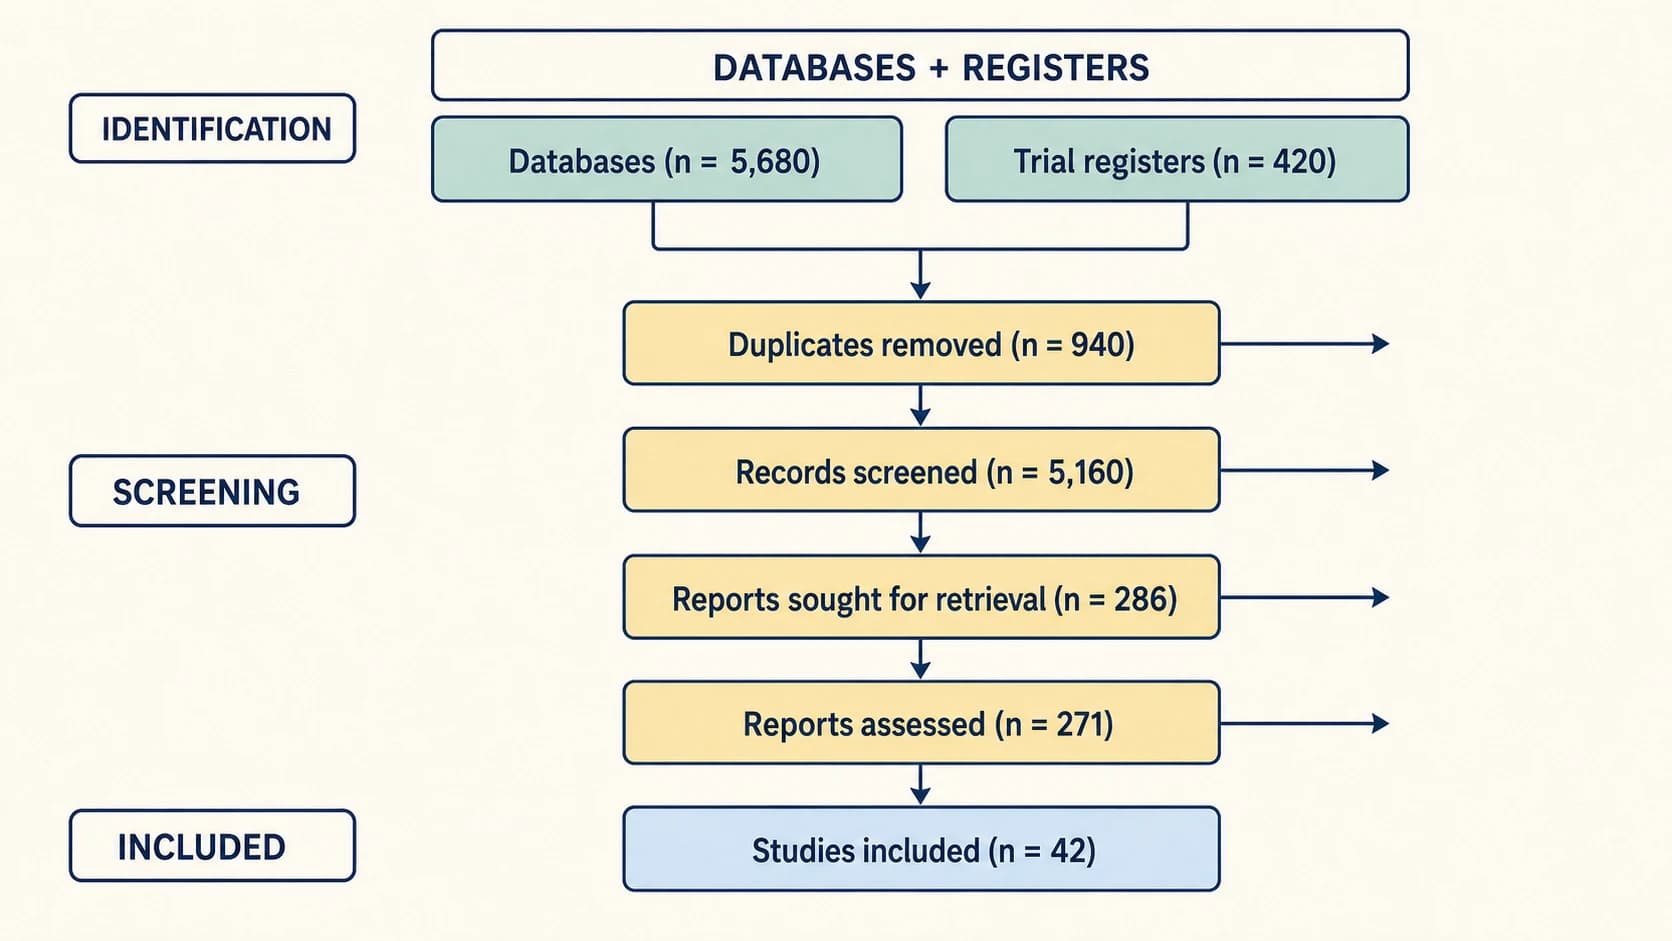
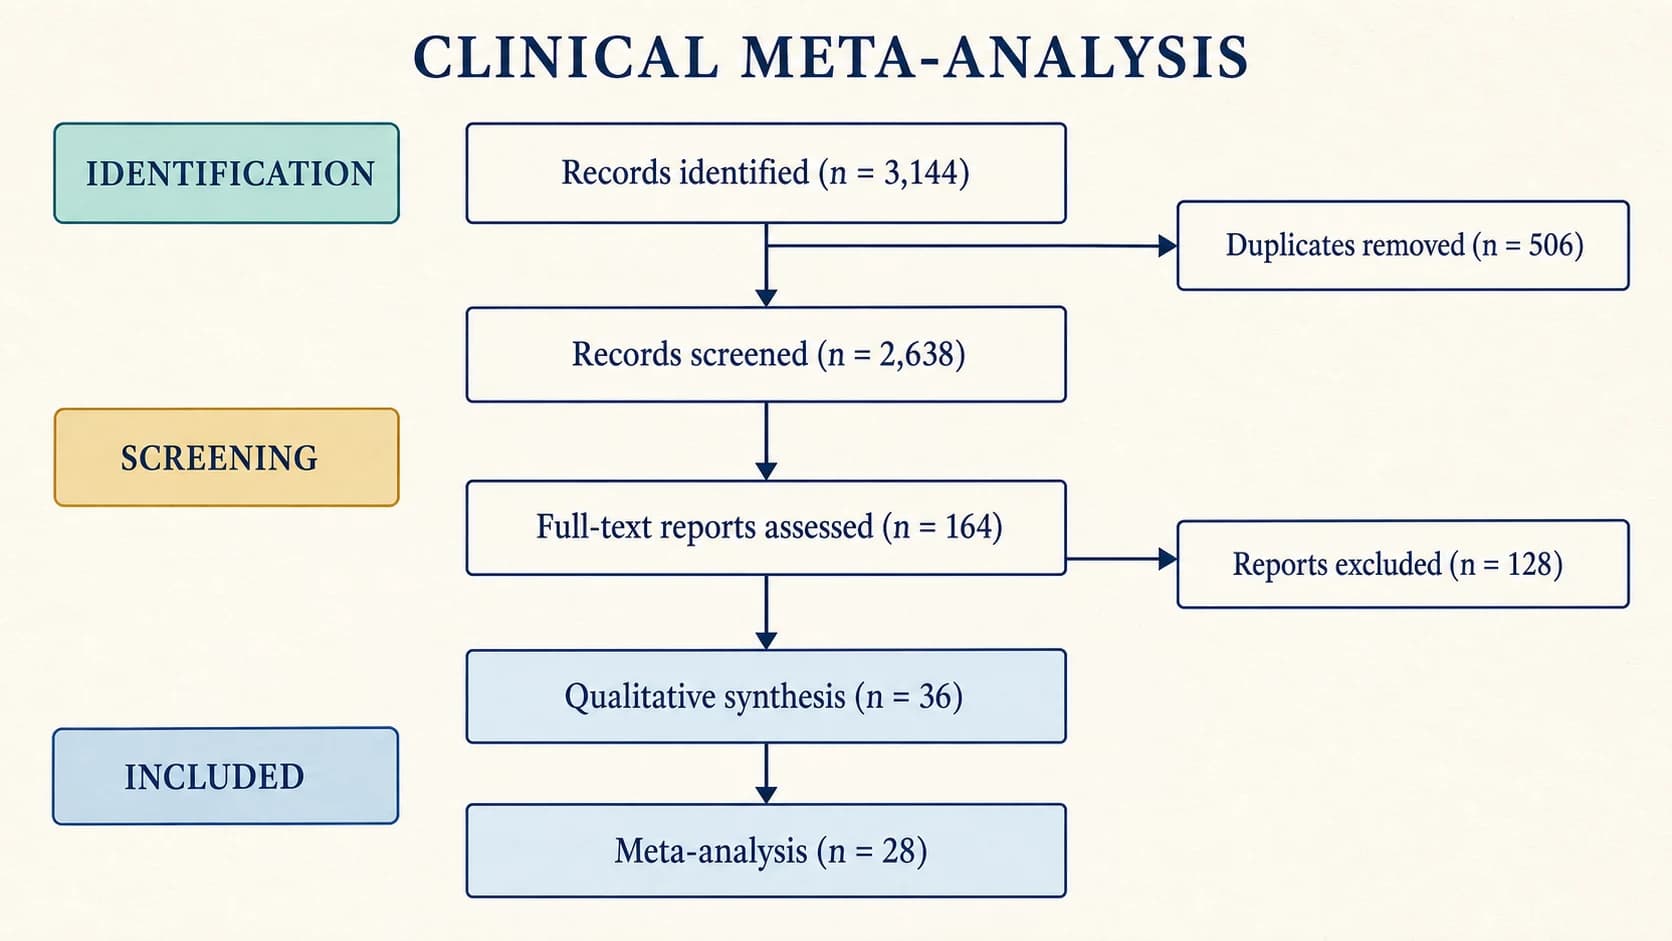
A PRISMA flow diagram is the standard figure used to show how evidence moved through a systematic review. It reports how many records were identified, removed, screened, retrieved, assessed, excluded, and included, so readers can audit the study-selection process.
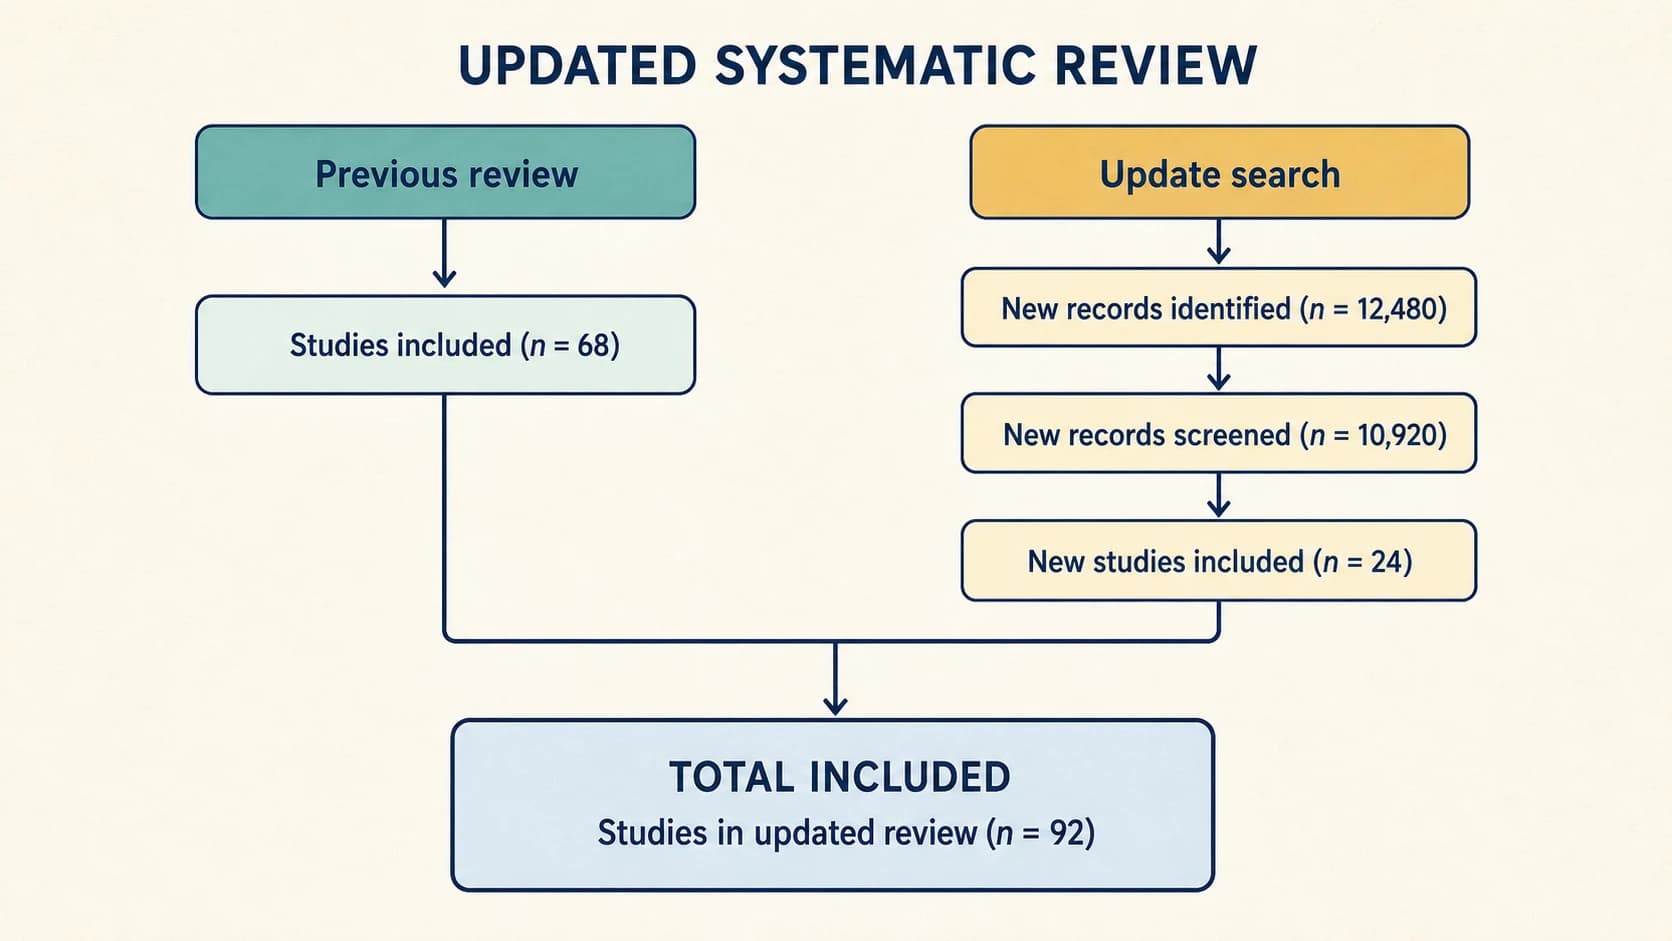
Published in 2021, the PRISMA 2020 statement includes a 27-item reporting checklist and flow-diagram templates for original and updated reviews. The diagram distinguishes records, reports, and studies because one study can produce several reports and each unit enters the selection process at a different stage.
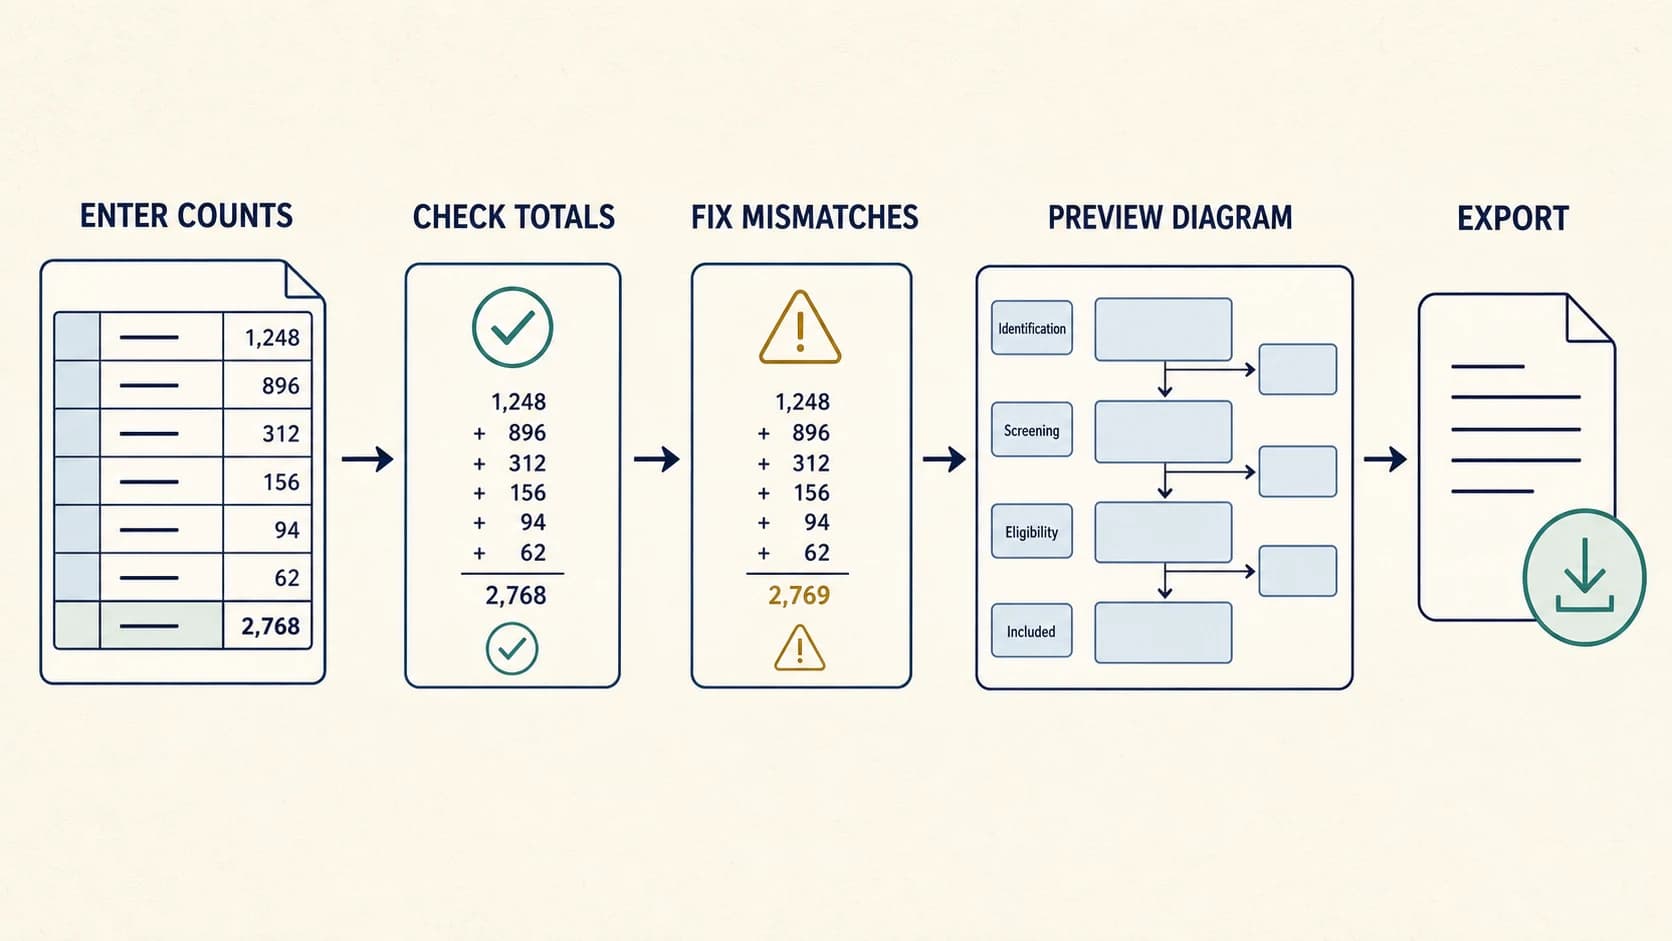
This generator turns the counts you already have into a live diagram. It also checks the arithmetic between stages, so a polished figure does not hide an impossible total.
Identification
Records found in databases and registers, plus removals before screening.
Screening
Records screened, records excluded, and reports sought for retrieval.
Eligibility
Full-text reports assessed and excluded, with reasons recorded in the review.
Included
Studies and reports that reach the final evidence set reported by the review.