• Logo
    PaperBananaAI Academic Illustration Generator
Home
  • Home
  • Studio
  • Scientific Illustration Generator
  • Poster Maker
  • Diagram Maker
  • Figure Editor
  • Pricing
My Creations
  • My Creations
  • Invite Friends
LogoPaperBanana
HomePricingInvite Friends
LogoPaperBanana

PaperBanana - AI-powered academic illustration generator

support@paperbanana.me

AI Tools

  • All Tools
  • Text to Illustration
  • Scientific Illustration Generator
  • Figure Editor
  • Diagram Maker
  • Poster Maker

Support

  • About
  • Pricing
  • Contact

Legal

  • Privacy Policy
  • Terms of Service
  • Acceptable Use

© 2026 PaperBanana. All Rights Reserved.

PricingContact
Online forest plot generator for meta-analysis

Forest Plot Maker for Publication-Ready Meta-Analysis

The Forest Plot Maker turns pasted Excel data or an uploaded CSV into a reviewable meta-analysis chart. Compare fixed and random effects, inspect heterogeneity, and export SVG or PNG without signing up or adding a watermark.

Paste from Excel or upload CSVFixed and random effectsQ, I², τ², and pooled effectSVG and PNG without watermarks

Study data and model

Paste a spreadsheet table with Study, Effect, Lower CI, Upper CI, and optional Subgroup columns.

clinical-odds-ratios.tsv

Study values and confidence intervals are ready.

Your study data stays in this browser unless you choose to open the figure in PaperBanana Studio.

Live forest plot

10
studies
0.77
pooled effect
0.00%
I²
0.00
τ²
Treatment effect across included studiesForest plot showing study effects, 95% confidence intervals, model weights, pooled estimate, and heterogeneity statistics.Treatment effect across included studiesOR · Random effects (DL) · 95% CIStudyOREffect (95% CI)WeightSmith 2018Smith 2018: 0.75 [0.55, 1.02]0.75 [0.55, 1.02]9.21%Johnson 2019Johnson 2019: 0.62 [0.41, 0.94]0.62 [0.41, 0.94]5.10%Williams 2019Williams 2019: 0.88 [0.72, 1.08]0.88 [0.72, 1.08]21.37%Brown 2020Brown 2020: 0.71 [0.52, 0.97]0.71 [0.52, 0.97]9.04%Davis 2020Davis 2020: 0.93 [0.68, 1.27]0.93 [0.68, 1.27]9.00%Miller 2021Miller 2021: 0.58 [0.38, 0.89]0.58 [0.38, 0.89]4.85%Wilson 2021Wilson 2021: 0.82 [0.65, 1.03]0.82 [0.65, 1.03]16.58%Taylor 2022Taylor 2022: 0.69 [0.49, 0.97]0.69 [0.49, 0.97]7.53%Anderson 2022Anderson 2022: 0.77 [0.58, 1.02]0.77 [0.58, 1.02]11.03%Thomas 2023Thomas 2023: 0.64 [0.44, 0.93]0.64 [0.44, 0.93]6.27%Pooled effect0.77 [0.70, 0.85]Prediction intervalQ = 7.73 · I² = 0.00% · τ² = 0.000.330.480.691.011.47Favours treatmentFavours control

Inverse-variance pooling with a 95% confidence interval. Random effects use the DerSimonian–Laird estimator. Verify the model against your review protocol before submission.

Forest plot basics

What a Forest Plot Shows in Meta-Analysis

A forest plot displays every study estimate in a meta-analysis on one aligned scale. Each square marks an effect estimate, each horizontal line shows its confidence interval, and the square size reflects the study weight used by the selected model.

The vertical reference line marks no effect: 1 for odds ratios, risk ratios, and hazard ratios, or 0 for mean differences. A pooled diamond summarizes the combined estimate when pooling is appropriate, while Q, I², and τ² describe statistical heterogeneity across studies.

This Forest Plot Maker accepts the estimates and confidence intervals researchers already keep in Excel. It validates the rows, derives standard errors, calculates fixed or DerSimonian–Laird random effects, and keeps the final figure editable as SVG.

01

Study estimate

The square shows the effect reported by each included study.

02

Confidence interval

The horizontal line shows the precision around that estimate.

03

Study weight

Square size reflects inverse-variance weight in the chosen model.

04

Pooled diamond

The diamond shows the combined effect and its 95% interval.

Method references

Check Forest Plot Methods Against Authoritative References

Use the generator for figure preparation, then confirm effect measures, model choices, and reporting details against your protocol and authoritative guidance.

Sources reviewed: September 2026

SourceFocusUse whenReference

Source

Cochrane Handbook

Focus

Meta-analysis methods

Use when

Confirm the effect measure, whether pooling is appropriate, how heterogeneity is interpreted, and whether fixed or random effects match the review protocol.

Reference

Chapter 10

Source

CDC

Focus

Forest plot presentation

Use when

Check required study fields, labels, axis choices, confidence intervals, and the plain-language explanation used beside the figure.

Reference

Forest Plot Guidelines

Source

metafor

Focus

Statistical implementation

Use when

Cross-check inverse-variance weighting, fixed-effect analysis, DerSimonian–Laird random effects, and forest plot output against an established R implementation.

Reference

rma.uni Reference

A polished plot does not make incompatible studies suitable for pooling. Review clinical and methodological heterogeneity before interpreting the diamond.

Forest Plot Examples for OR, RR, HR, MD, and SMD Data

Load an example to inspect the study table, model, weights, confidence intervals, pooled effect, and subgroup layout.

Built for evidence synthesis

Create Forest Plots for Reviews, Theses, and Manuscripts

Create a first plot from Excel, review the model and heterogeneity, then export a figure collaborators can inspect.

Medical researcher creating a forest plot from systematic review data

Systematic reviews and theses

Turn an extracted-effects spreadsheet into a clear figure without constructing error bars manually in Excel.

Biostatistician reviewing forest plot heterogeneity and model results

Meta-analysis model review

Compare fixed and random effects while keeping pooled estimates, weights, Q, I², and τ² visible.

Research team reviewing a publication-ready forest plot during revision

Manuscript revisions

Update one study or subgroup and export a fresh SVG or PNG without rebuilding the entire figure.

Forest Plot Maker capabilities

Create a Forest Plot From Excel or CSV Data

Keep every input, model choice, calculation, and export connected in one browser-based workflow.

Start With Clean, Plot-Ready Study Data

Map common Excel and CSV headers automatically, skip incomplete rows, and flag intervals that do not contain the reported estimate.

Use Forest Plot Maker
Forest plot data validation workflow checking effect and confidence interval columns

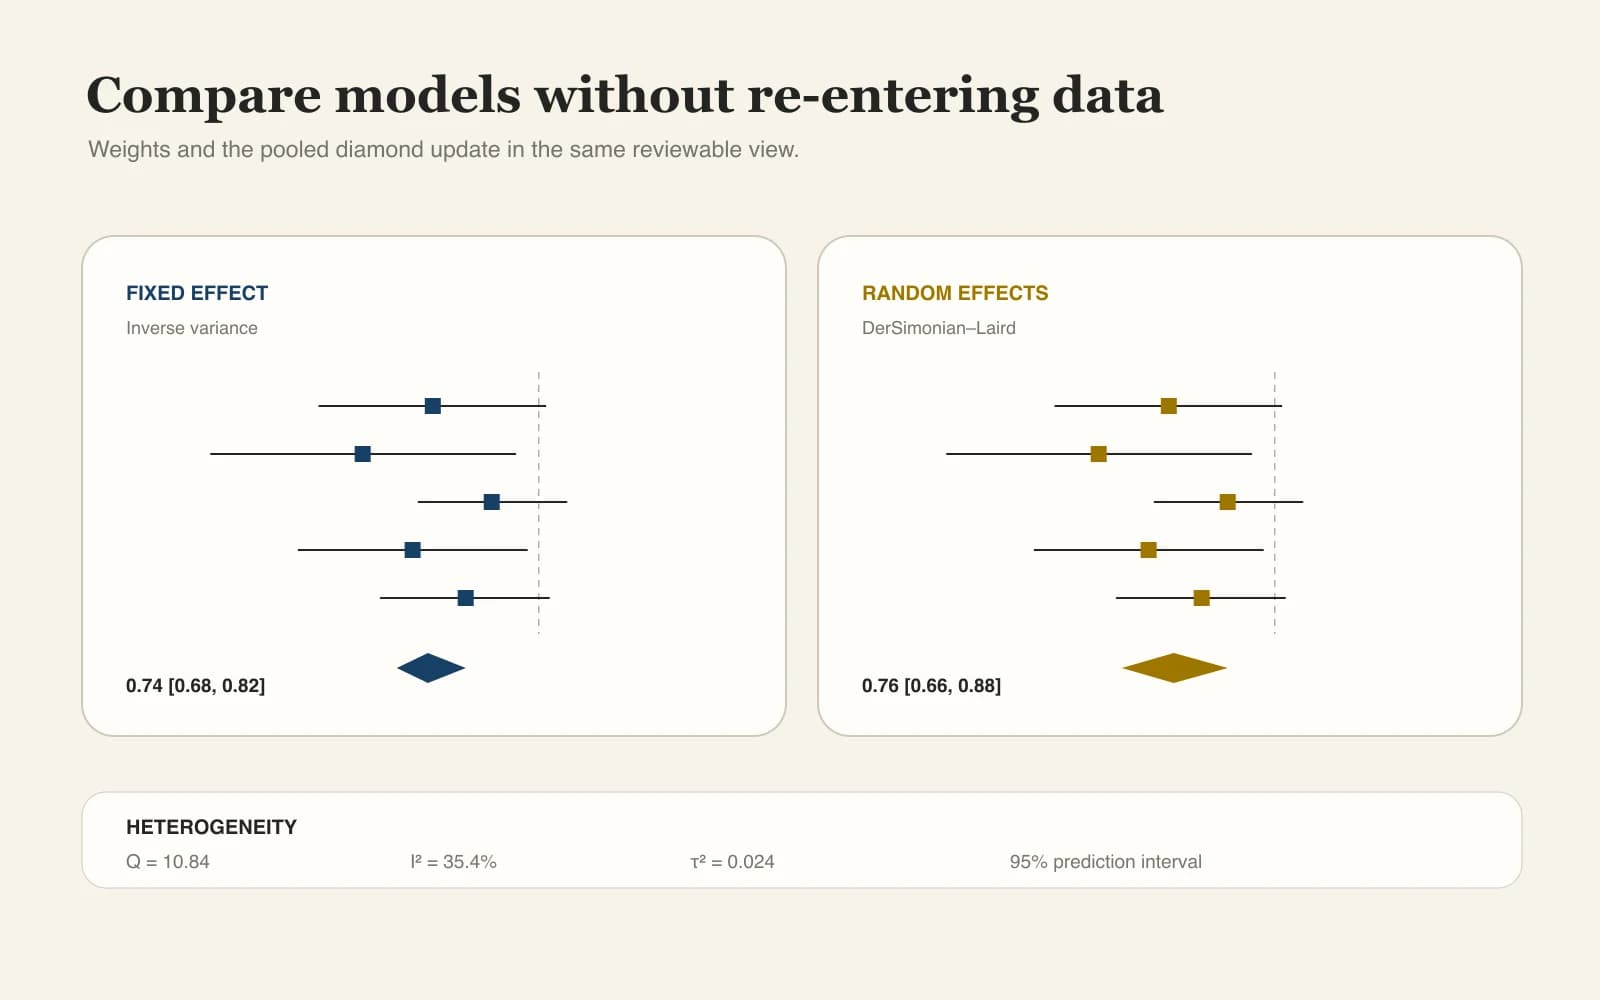
Compare Fixed and Random Effects Before Reporting

Switch pooling models without re-entering data and see how weights, the pooled diamond, Q, I², and τ² respond.

Use Forest Plot Maker
Fixed and random effects controls beside forest plot model results

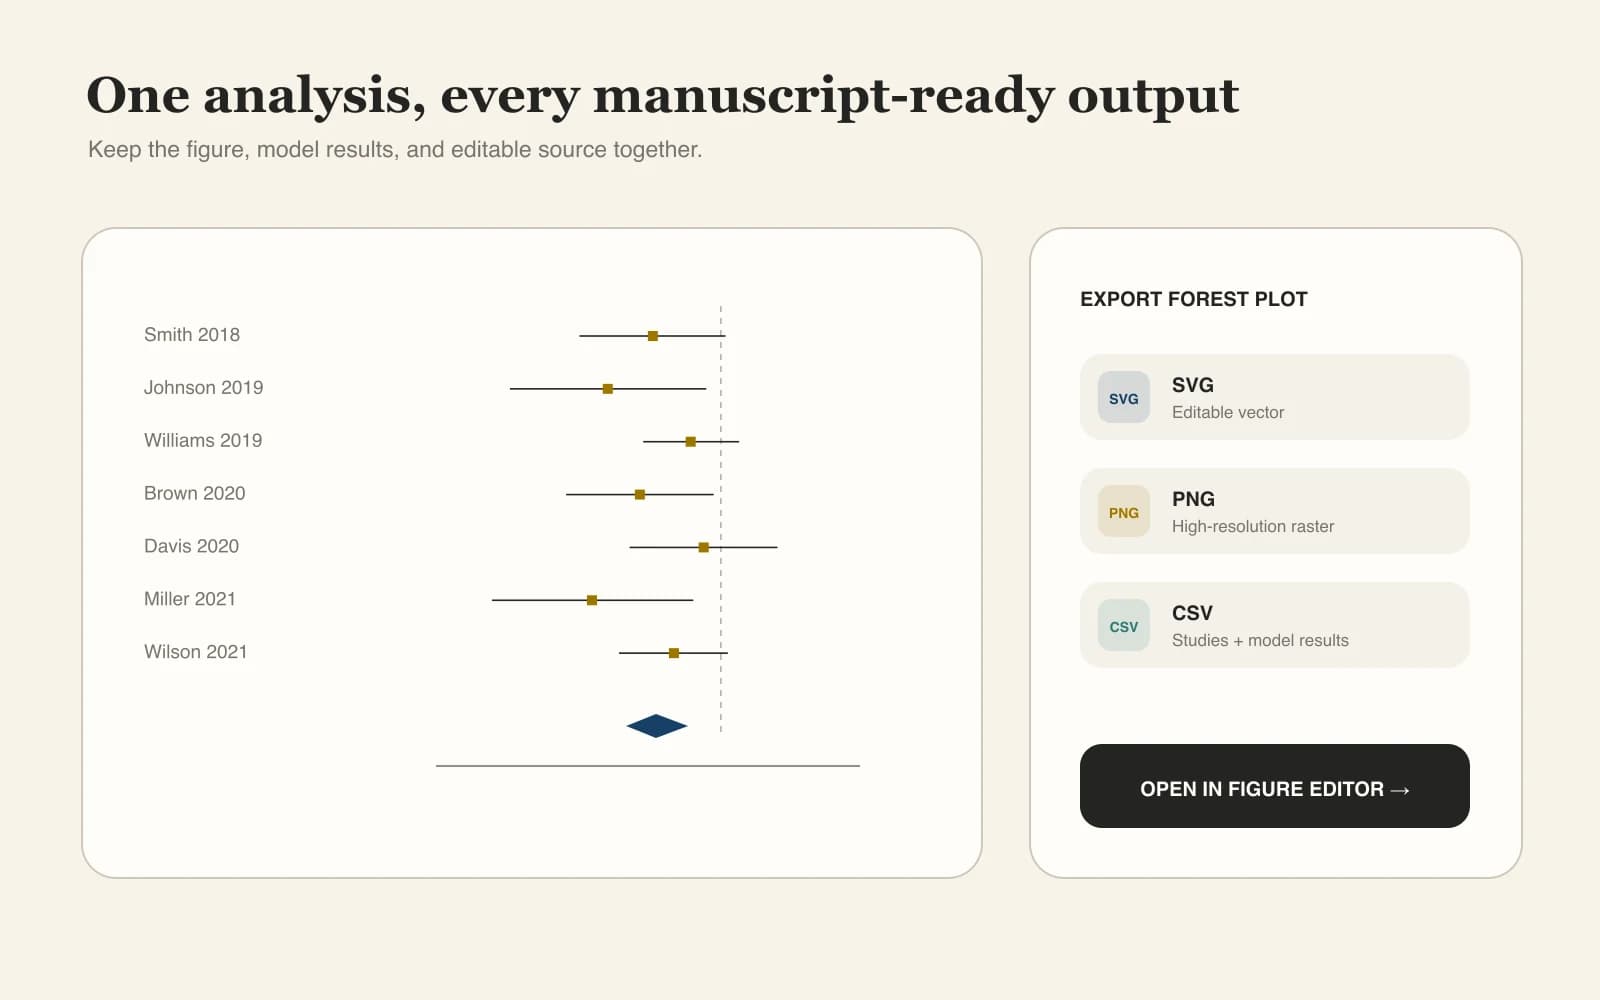
Export an Editable Figure for Journal Submission

Download editable SVG or high-resolution PNG with study labels, exact intervals, weights, and method notes preserved.

Use Forest Plot Maker
Publication export workflow for forest plot SVG PNG and results CSV

Why researchers use it

Compare Fixed and Random Effects With Confidence

Spend review time on whether the studies belong together, not on chart workarounds and manual alignment.

Excel-ready

Paste data you already have

Move directly from Excel, CSV, or TSV into the plot without entering each study through a long wizard.

Live analysis

See model changes immediately

Switch fixed or random effects and review the change in weights and the pooled result in the same view.

Reviewable

Keep statistics transparent

Show the exact per-study effect, 95% confidence interval, weight, Q, I², and τ² used in the figure.

No forced pooling

Choose whether to pool

Hide the pooled diamond when clinical or methodological heterogeneity makes a single summary inappropriate.

SVG export

Preserve vector quality

Use SVG for later editing and high-resolution PNG for Word, slides, and common submission systems.

Private by default

Keep unpublished data local

Parsing and calculation happen in the browser until you intentionally open the figure in the editor.

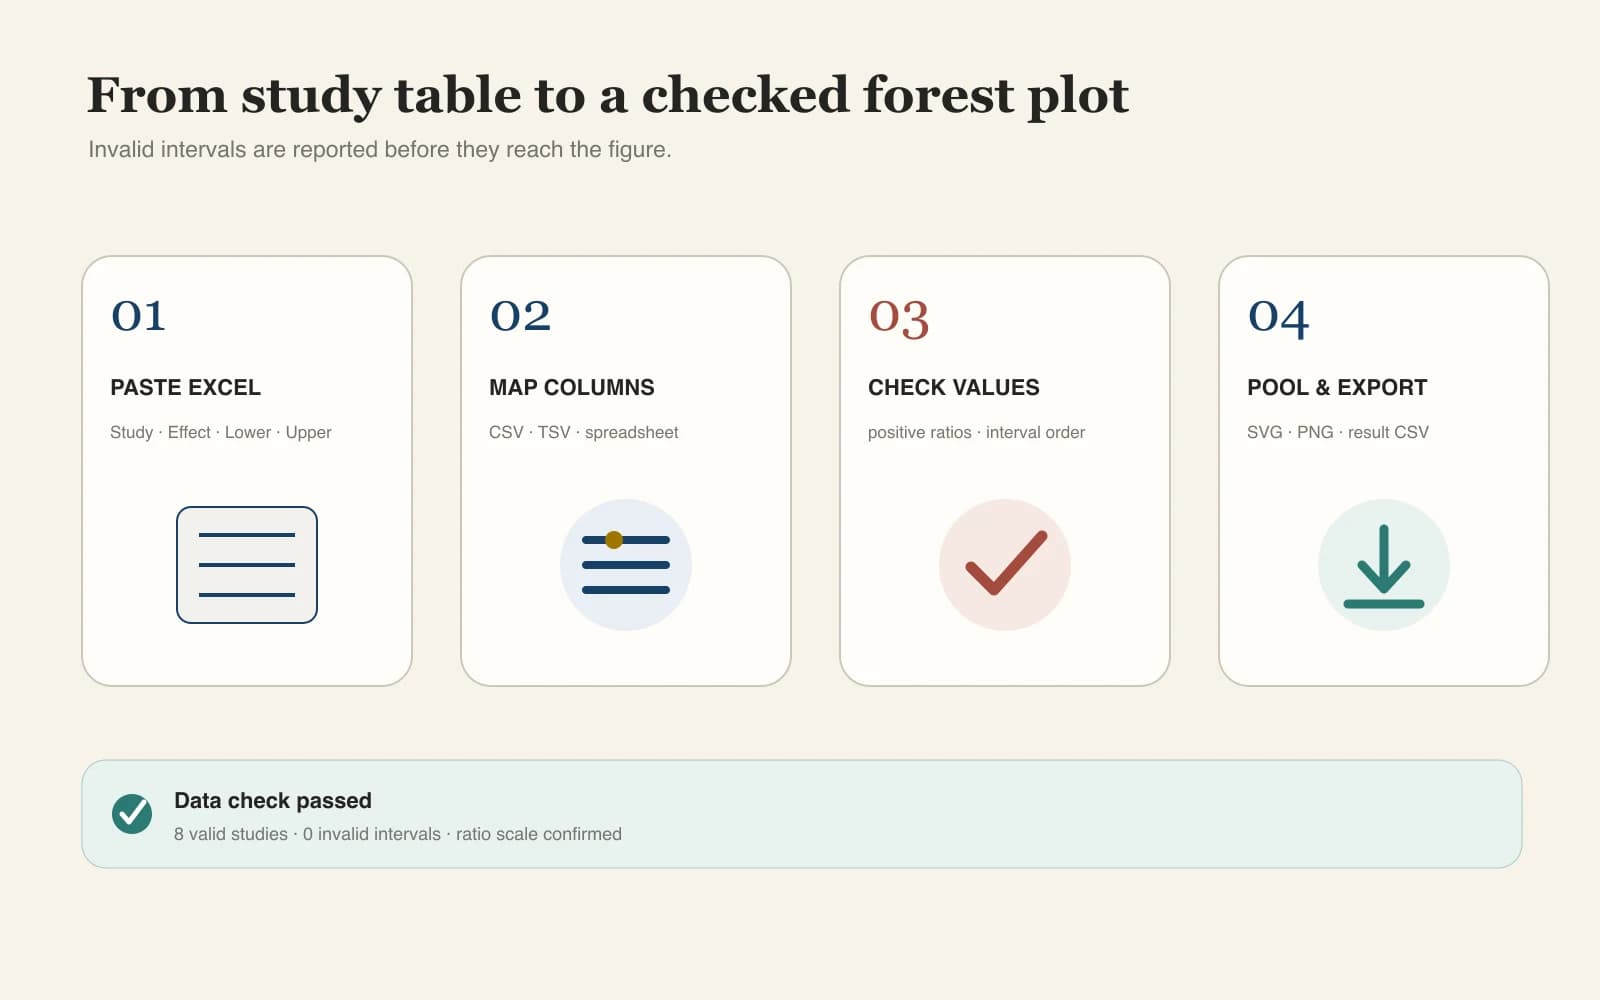
Four-step workflow

How to Make a Forest Plot From Excel in 4 Steps

Prepare the study estimates, import the table, choose the analysis model, and export the finished forest plot.

01

Prepare Study Effects and 95% Intervals

Use one row per study with a label, effect estimate, lower confidence limit, upper confidence limit, and optional subgroup.

02

Paste Excel Data or Upload a CSV

The Forest Plot Maker recognizes common headers and reports any rows that cannot be plotted safely.

03

Choose the Effect Measure and Model

Select OR, RR, HR, MD, or SMD, then compare fixed effect with DerSimonian–Laird random effects.

04

Review and Export the Forest Plot

Check study weights, the pooled diamond, prediction interval, and heterogeneity before exporting SVG, PNG, or results CSV.

Use Forest Plot Maker
Four-step workflow from Excel study data to a publication-ready forest plot
The generator handles plotting and calculations; the review team remains responsible for study compatibility and model choice.

Continue the research workflow

Continue Your Systematic Review Workflow

Document study screening, summarize the evidence visually, check journal requirements, and prepare the finished review for presentation.

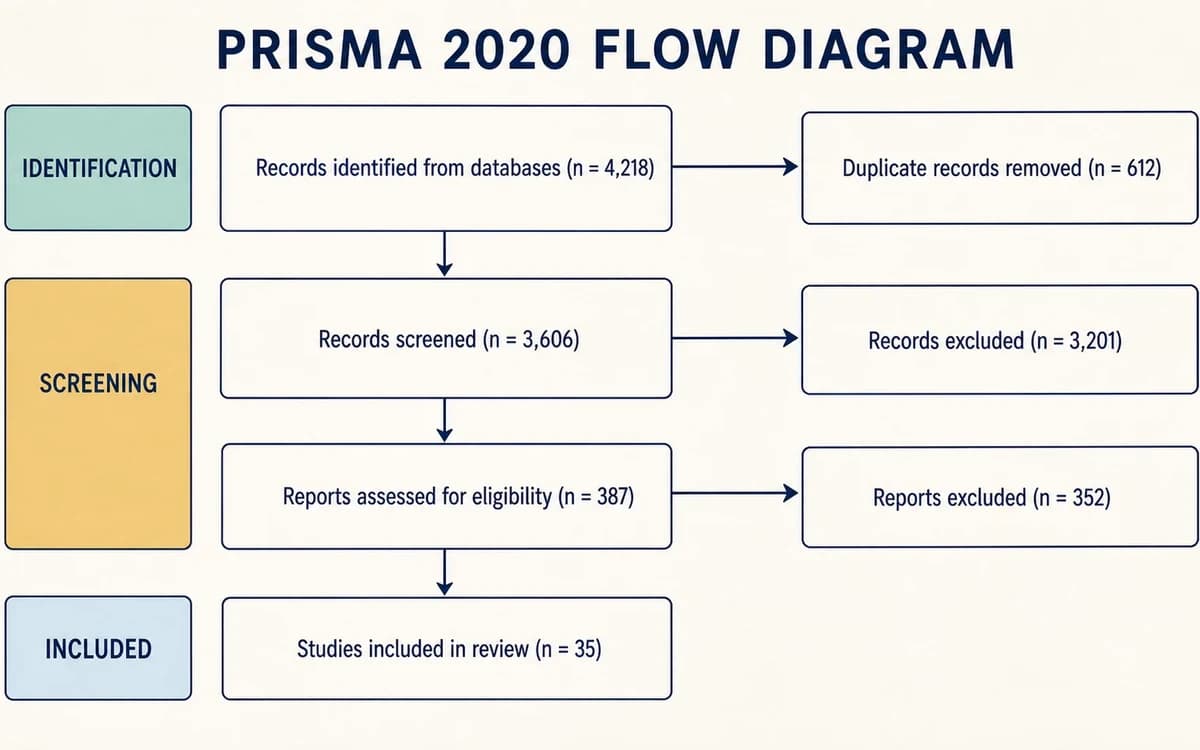
PRISMA flow diagram generator for systematic review screening counts

PRISMA Flow Diagram Generator

Validate identification, screening, eligibility, and inclusion counts in a PRISMA 2020 flow diagram.

Funnel Plot Maker for exploring small-study effects in meta-analysis

Funnel Plot Maker

Plot study effects against standard error to explore small-study patterns after pooling the evidence.

Journal figure checker reviewing forest plot submission requirements

Journal Figure Checker

Check dimensions, resolution, file format, color mode, and typography before journal submission.

Scientific poster maker arranging a systematic review forest plot

Scientific Poster Maker

Place the forest plot and supporting evidence into an editable conference poster.

Forest Plot Maker FAQ

Forest Plot Maker Questions

What data do I need to create a forest plot?+

A forest plot needs one row per study with a label, effect estimate, lower 95% confidence limit, and upper 95% confidence limit. Add an optional subgroup column to group related studies, then select OR, RR, HR, MD, or SMD so the reference line and calculations use the correct scale.

How do I make a forest plot from Excel or CSV data?+

Copy the table from Excel and paste it into the study-data field, or upload a CSV or TSV file. Use headers such as Study, Effect, Lower CI, Upper CI, and Subgroup. The Forest Plot Maker validates the rows and updates the chart locally in your browser without requiring an account.

Which forest plot model should I use: fixed or random effects?+

Use a fixed-effect model when the protocol assumes one shared underlying effect; use random effects when true effects may vary across studies. The decision should reflect the review question, study compatibility, and prespecified method rather than I² alone. Compare both results here, then justify the final choice in the manuscript.

How does the Forest Plot Maker calculate weights and pooled effects?+

The Forest Plot Maker derives standard errors from each 95% confidence interval and applies inverse-variance weighting. Random effects add a DerSimonian–Laird estimate of between-study variance, τ², before normalizing weights. The pooled diamond displays the weighted estimate and 95% confidence interval produced by the selected model.

How can I create a forest plot without pooling the studies?+

Turn off the pooled-effect option to display individual estimates and confidence intervals without a summary diamond. This presentation is appropriate when clinical, methodological, or conceptual differences make one combined estimate misleading. Studies can still be ordered by subgroup and compared on one consistent effect scale.

Which formats can I export for a publication-ready forest plot?+

Export SVG for scalable editing, PNG for manuscripts or presentations, and CSV for the calculated results. The figure retains study labels, confidence intervals, model weights, pooled statistics, and heterogeneity details without a watermark. Before submission, confirm the target journal’s required dimensions, fonts, resolution, and file format.

Why are ratio measures shown on a logarithmic scale?+

Odds ratios, risk ratios, and hazard ratios are positive and have a no-effect value of 1. Pooling and plotting them on a logarithmic scale treats reciprocal effects symmetrically and keeps confidence intervals mathematically consistent. Mean differences and standardized mean differences use a linear scale with 0 as no effect.

From extracted data to a reviewable figure

Create a Publication-Ready Forest Plot Now

Paste the study table, compare models, check heterogeneity, and export a clear figure without rebuilding Excel error bars.

Use Forest Plot Maker