Organize concepts, language, learning, comparisons, and stories with editable diagrams.
Use Frayer for definitions, KWL for learning questions, and Compare and Contrast or Venn for similarities and differences. Cause and Effect connects events, Spider expands a topic, and Plot Diagram structures a story; the general organizer combines common templates. Use Syntactic Tree Generator to draft a tree from a short English sentence or draw your own labeled bracket analysis. Use Sentence Diagram Generator to enter grammatical parts and arrange them as a Reed–Kellogg diagram with a horizontal baseline and modifier branches. Use Punnett Square Maker to combine parental alleles, check predicted genotype and phenotype ratios, or make a practice worksheet.

Create editable Frayer, KWL, Venn, and cause-and-effect worksheets, then export or print them free.
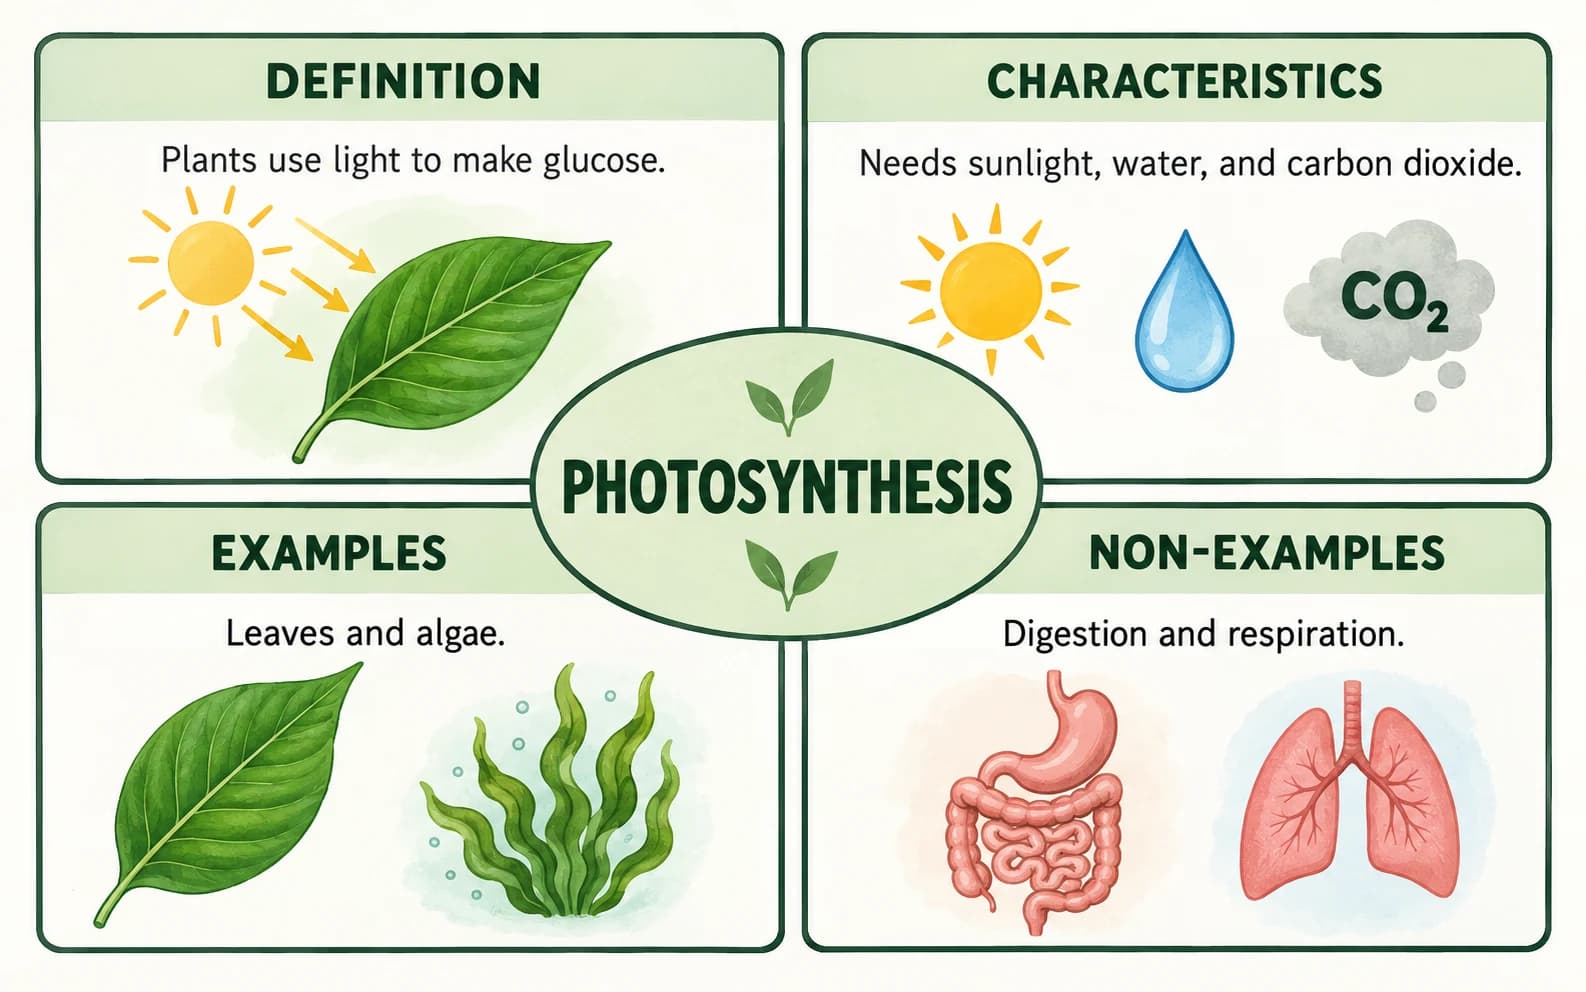
Create a filled vocabulary model or blank printable Frayer worksheet, then export it as SVG, PNG, or PDF without signing up.
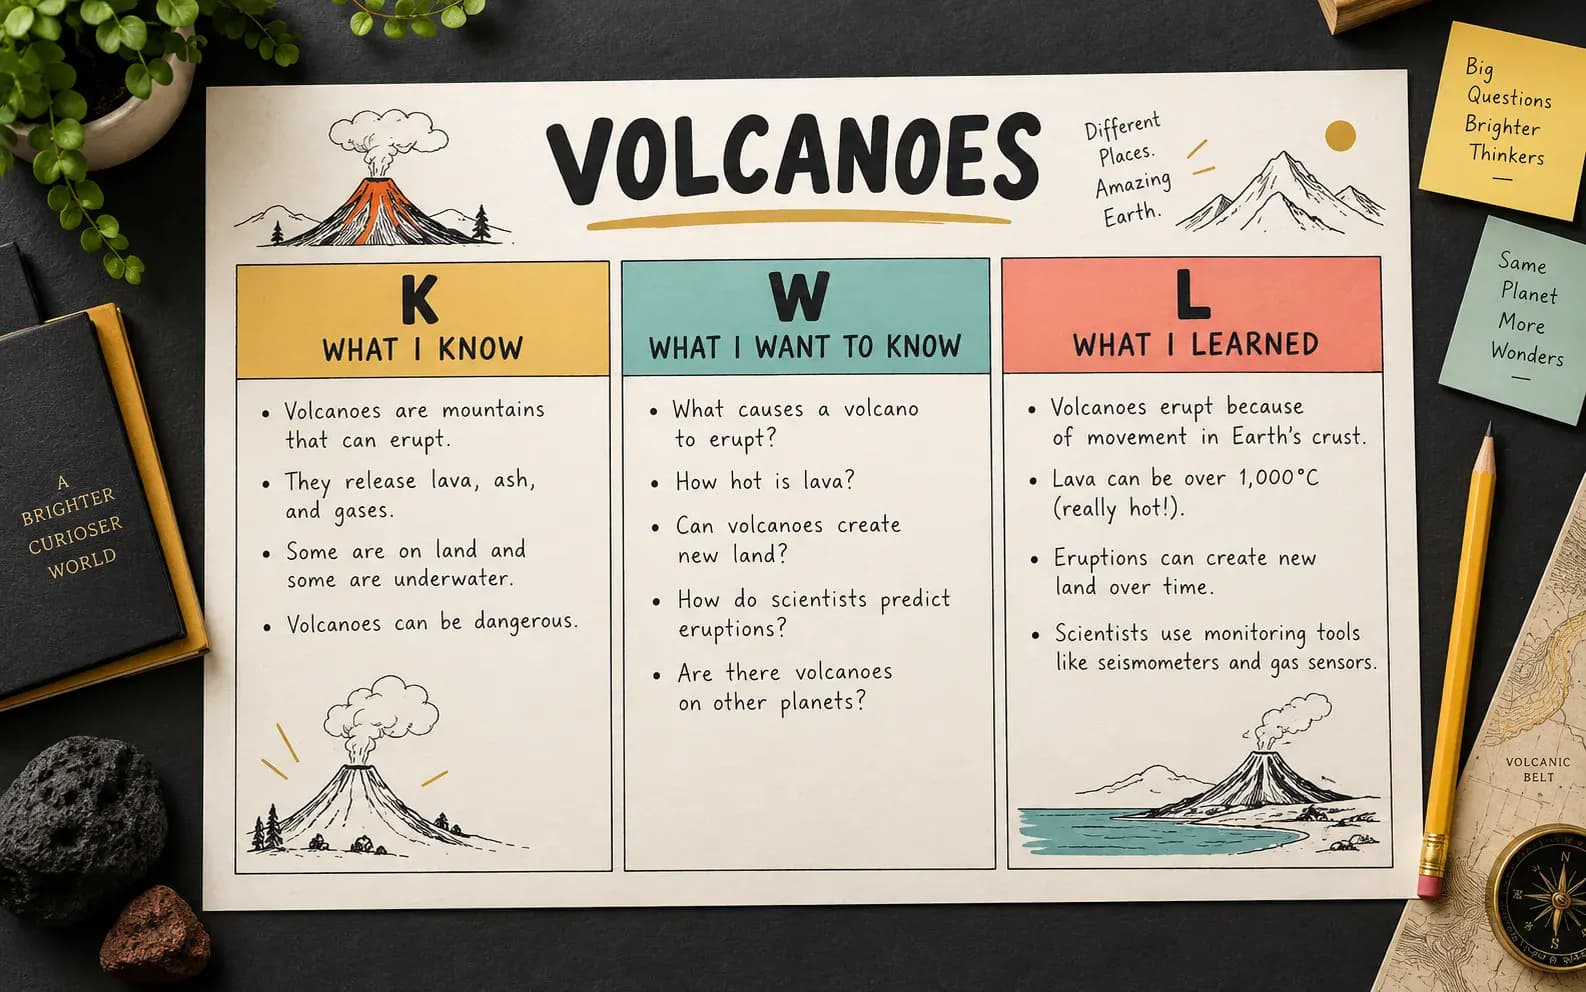
Create editable KWL or KWHL charts, switch between filled and blank worksheets, and export SVG, PNG, or PDF.
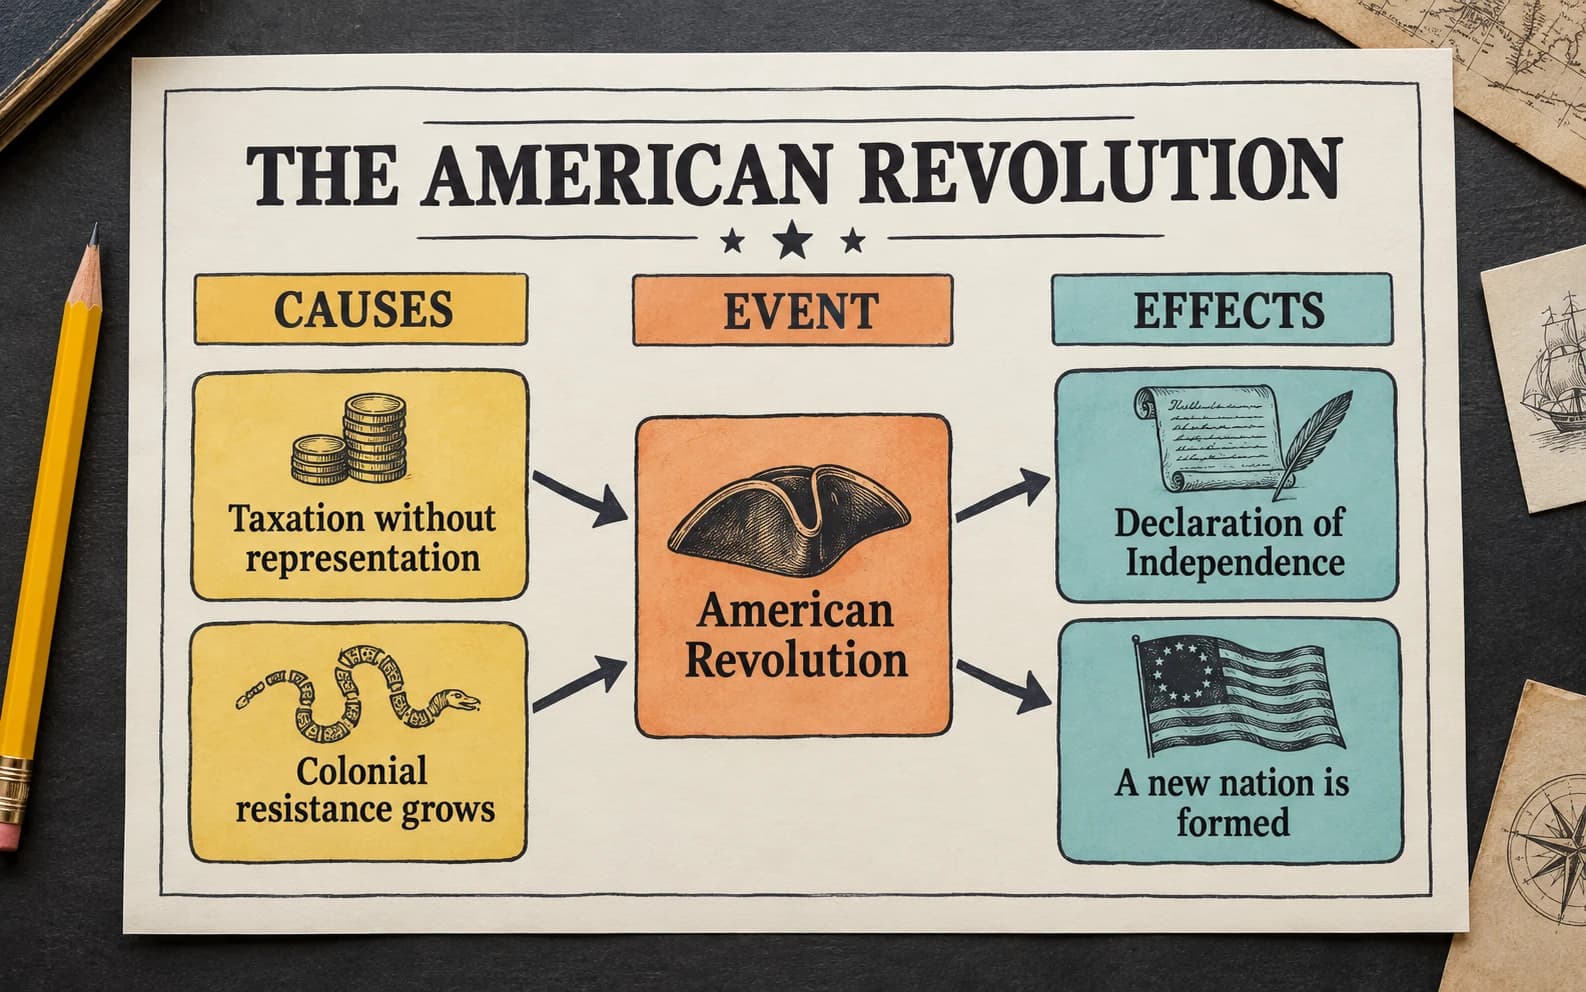
Map multiple causes and effects or build an event chain, then export a filled example or blank printable worksheet.
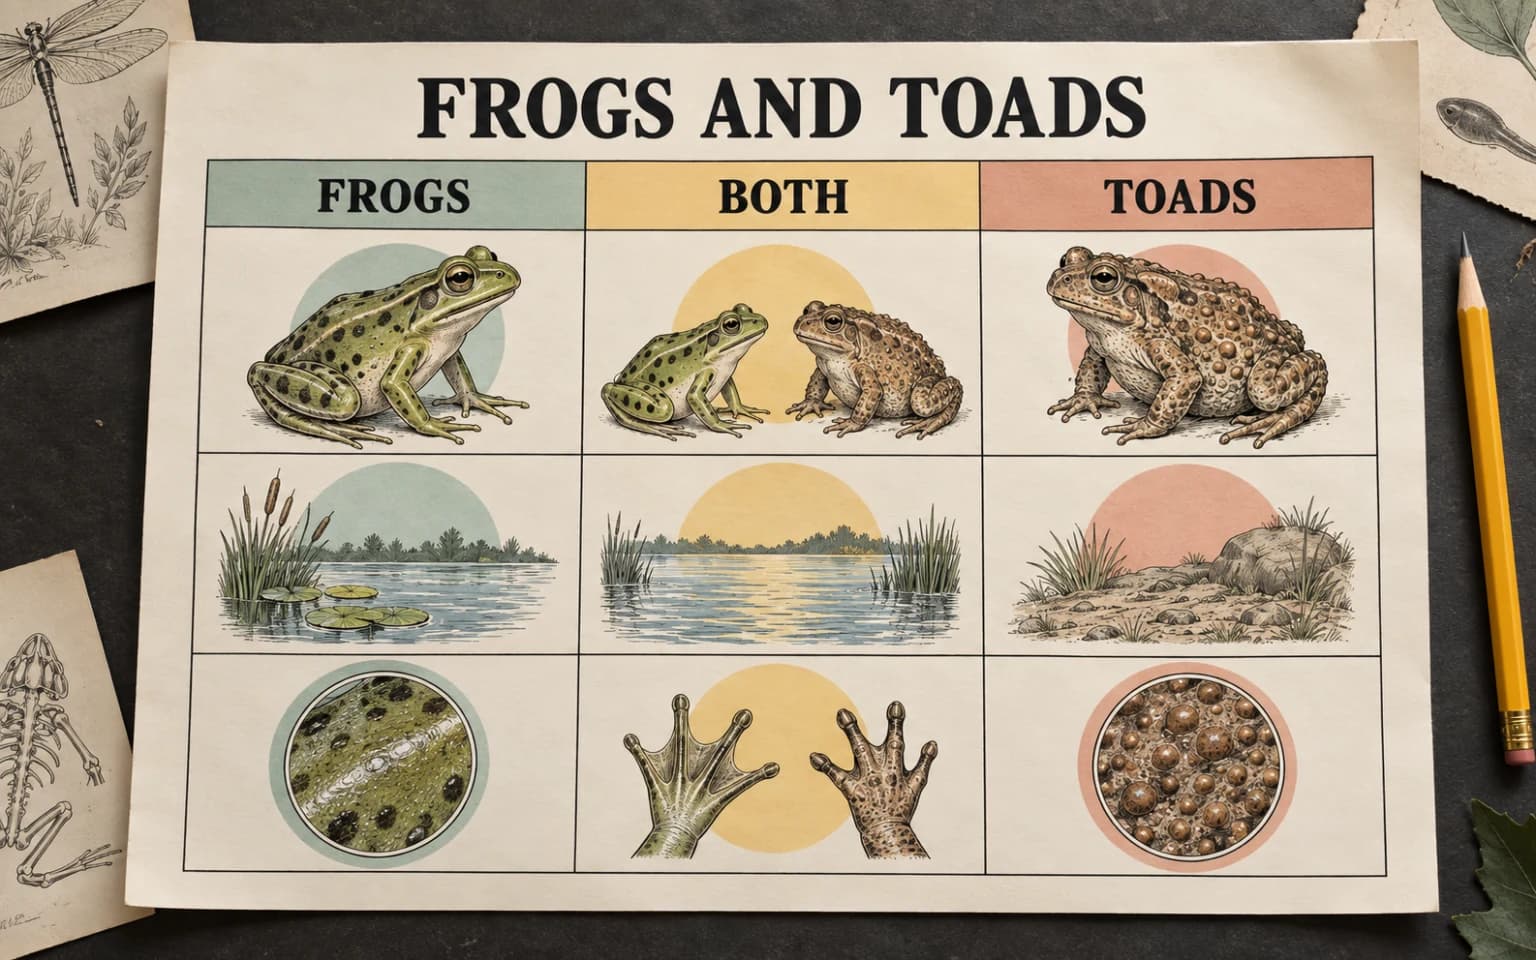
Compare 2–5 subjects by the same categories, then export a filled model or blank printable worksheet.
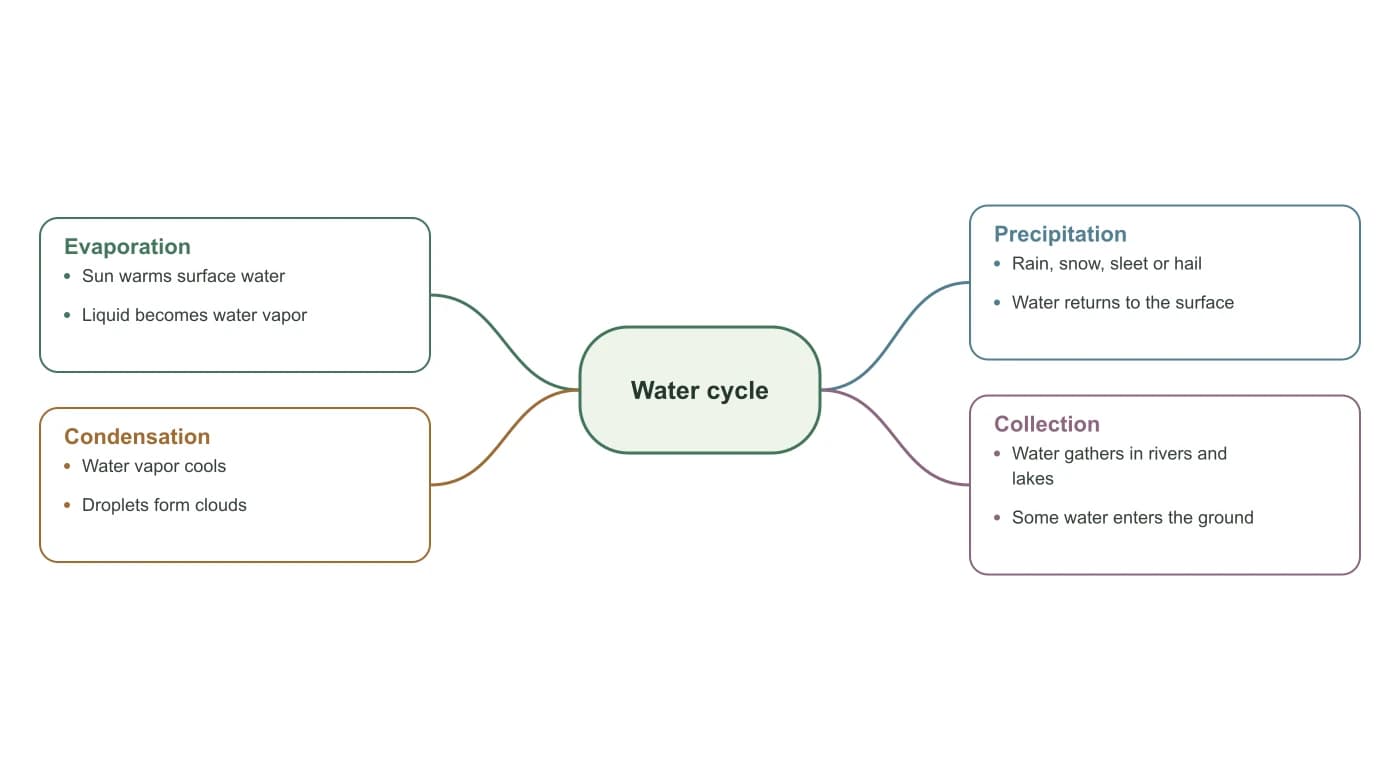
Organize a topic into editable branches for brainstorming, revision and writing.
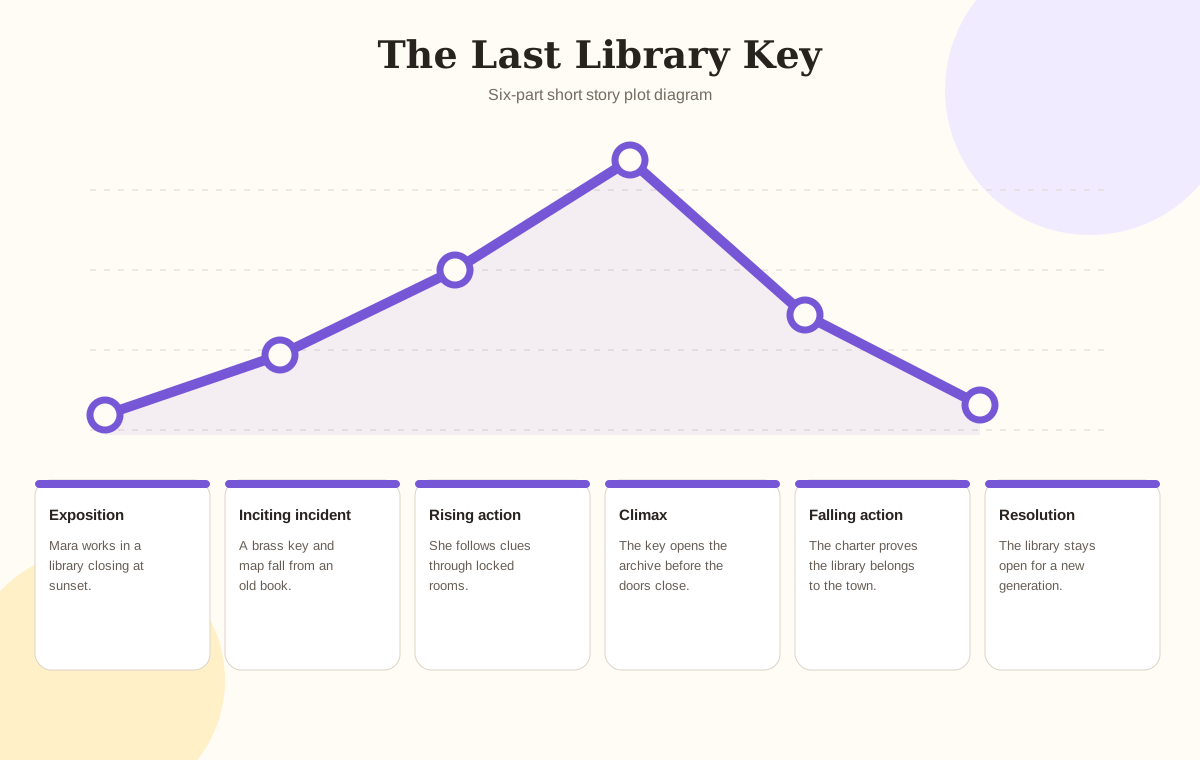
Map story events onto an editable tension curve, then export a finished plot diagram or blank worksheet.
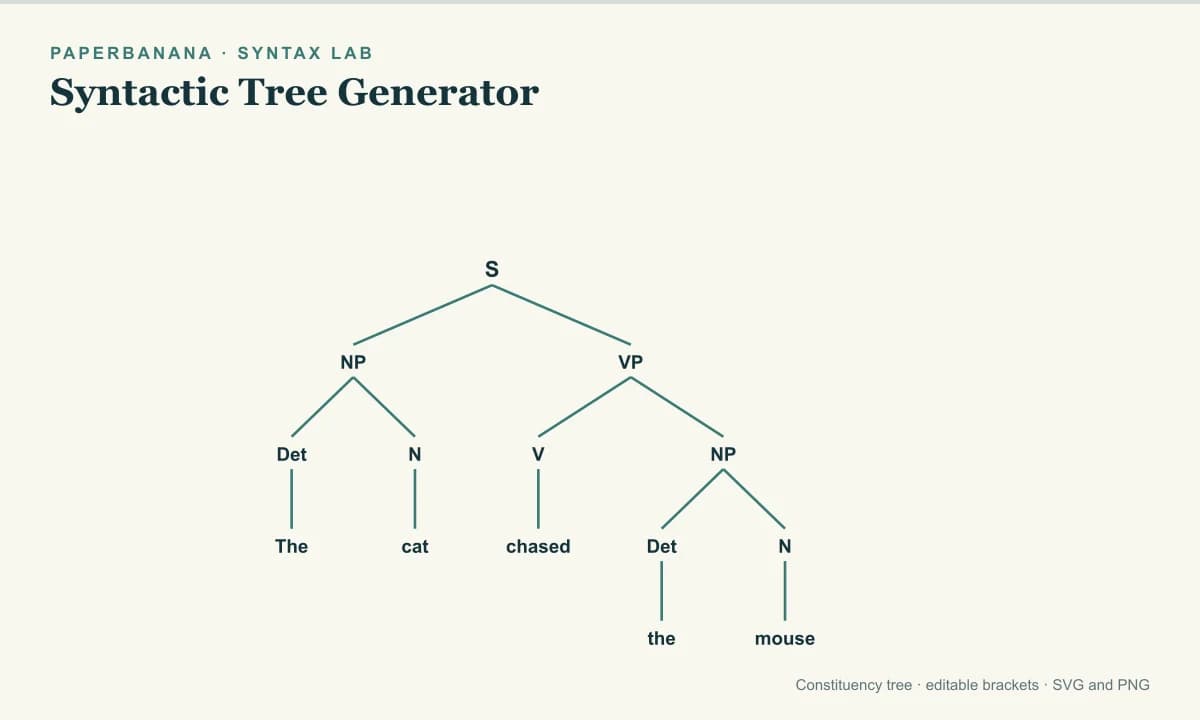
Draft a constituency tree from a short English sentence, edit labeled brackets, and export SVG or PNG.
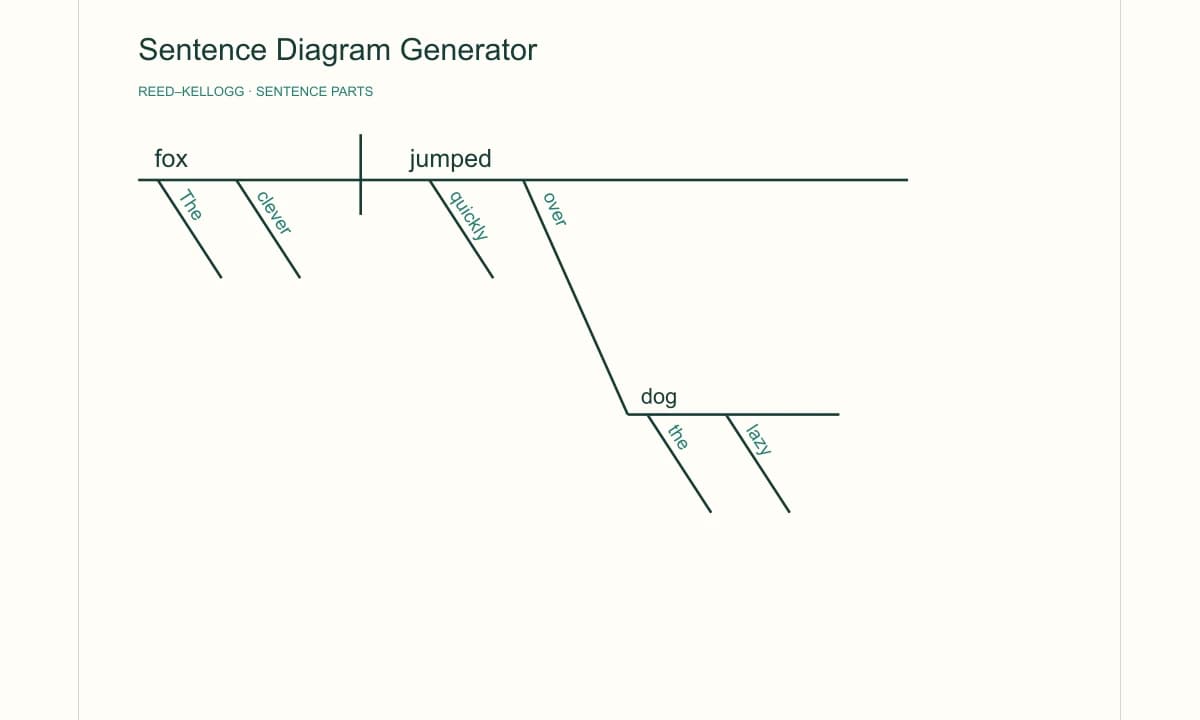
Enter subjects, verbs, objects, and modifiers to build a Reed–Kellogg sentence diagram, check word coverage, and export SVG or PNG.
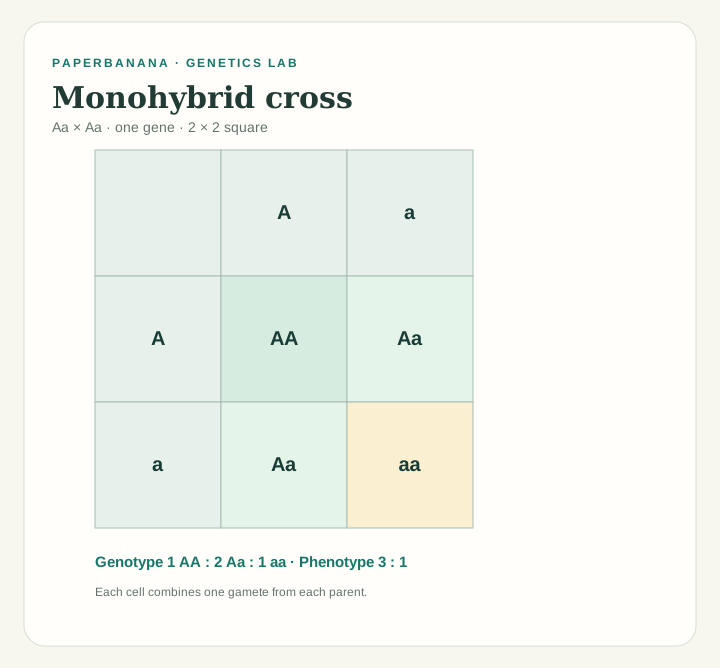
Create 2×2 or 4×4 Punnett squares, check genotype and phenotype ratios, and export genetics worksheets.
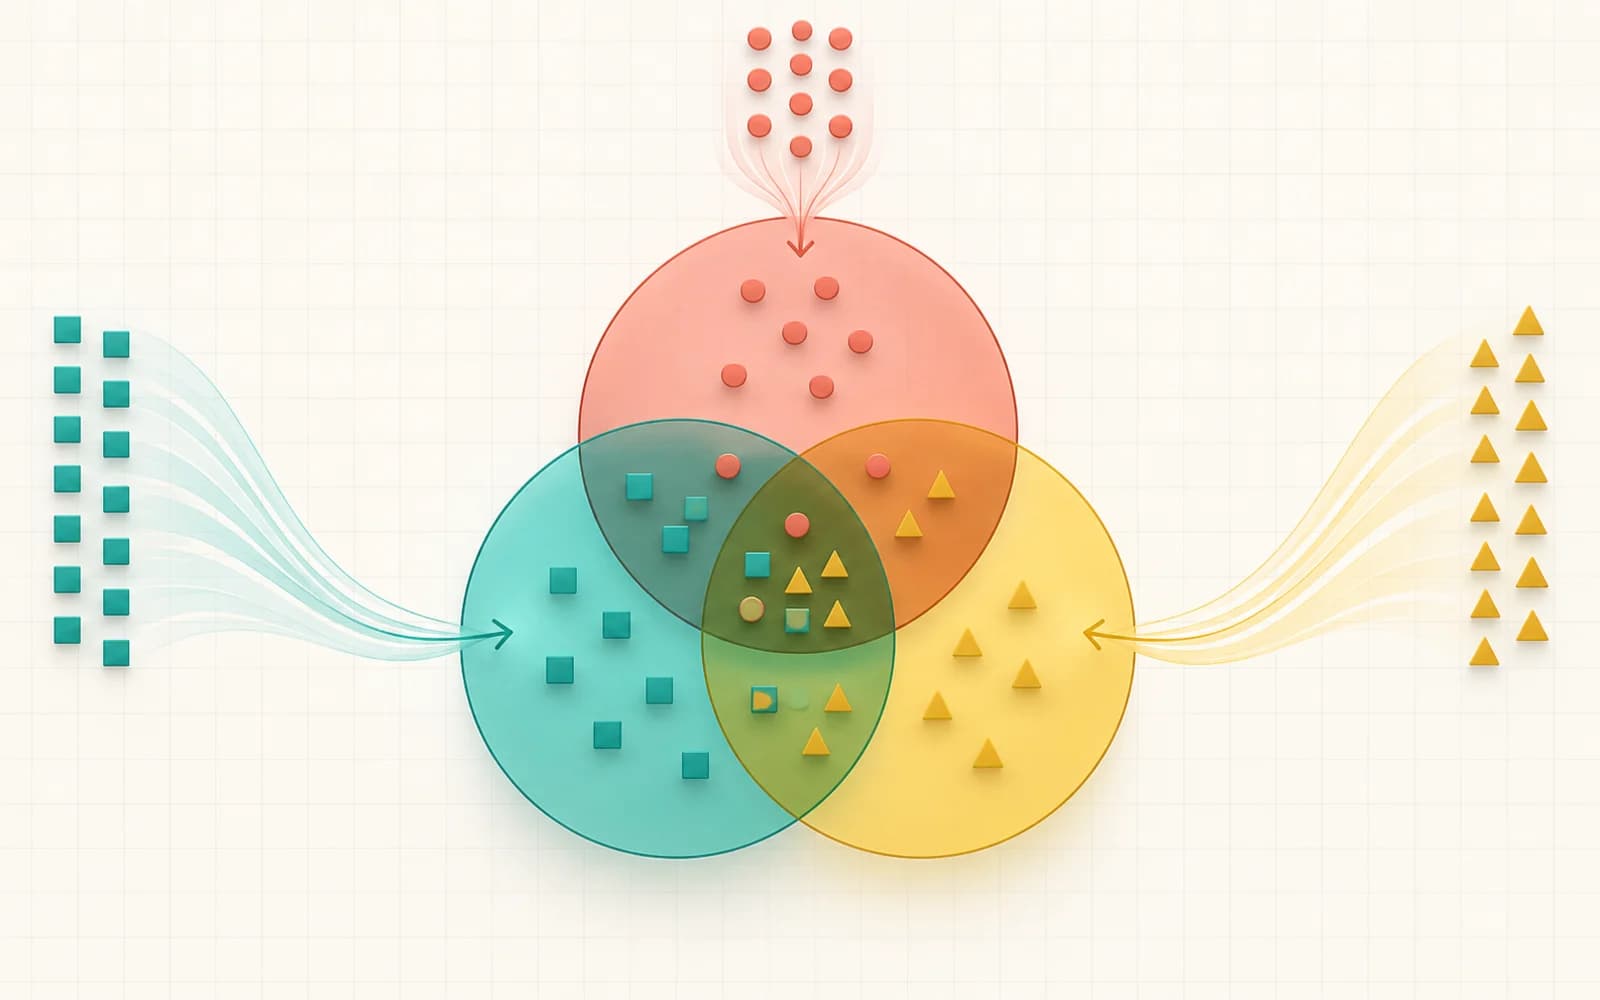
Paste lists or import CSV data, calculate exact overlaps across 2–6 sets, and export SVG or PNG.


