• Logo
    Paper BananaAI Academic Illustration Generator
Home
  • Home
  • Studio
  • Scientific Illustration Generator
  • Poster Maker
  • Diagram Maker
  • Figure Editor
  • Pricing
My Creations
  • My Creations
  • Invite Friends
LogoPaper Banana
HomePromptsBlogPricingInvite Friends
  1. Home
  2. Tools
  3. Math & Physics
Paper Banana

Paper Banana - AI-powered academic illustration generator

support@paperbanana.me
All Tools

Tool directory

AI Figure Tools

  • Scientific Illustration
  • Graphical Abstract Maker
  • Scientific Poster Maker
  • Scientific Diagram Maker
  • Scientific Figure Editor
  • Prompts

Research Diagrams

  • Pedigree Chart Maker
  • Cladogram Maker
  • Conceptual Framework Generator
  • Neural Network Diagram Generator
  • PRISMA Flow Diagram Generator
  • CONSORT Flow Diagram Generator

Graphic Organizers

  • Graphic Organizer Maker
  • Frayer Model Maker
  • KWL Chart Maker
  • Cause and Effect Graphic Organizer
  • Compare and Contrast Graphic Organizer
  • Spider Diagram Maker
  • Plot Diagram Maker
  • Syntactic Tree Generator
  • Sentence Diagram Generator
  • Punnett Square Maker
  • Venn Diagram Maker

Math & Physics

  • Molecular Orbital Diagram Generator
  • Lewis Dot Structure Generator
  • Factor Tree Generator
  • Number Line Generator
  • Force Diagram Maker
  • Bohr Model Maker

Data Visualization

  • Dendrogram Maker
  • Bell Curve Generator
  • Histogram Maker
  • Waterfall Chart Generator
  • Scientific Color Palette Generator
  • Sankey Diagram Generator
  • Scatter Plot Maker
  • Dot Plot Maker
  • Forest Plot Maker
  • Funnel Plot Maker
  • Kaplan-Meier Curve Maker
  • Box Plot Maker
  • Heatmap Generator
  • Volcano Plot Generator
  • Phylogenetic Tree Generator

Image & Submission

  • Scientific Figure Checker
  • Image Format Converter

© 2026 Paper Banana. All Rights Reserved.

Support

  • About
  • Blog
  • Pricing
  • Contact

Legal

  • Privacy Policy
  • Terms of Service
  • Acceptable Use

Math & Physics

Make factor trees, number lines, force diagrams, Bohr atom models, Lewis dot structures, and molecular orbital diagrams for clear, printable learning materials.

Choose the right tool

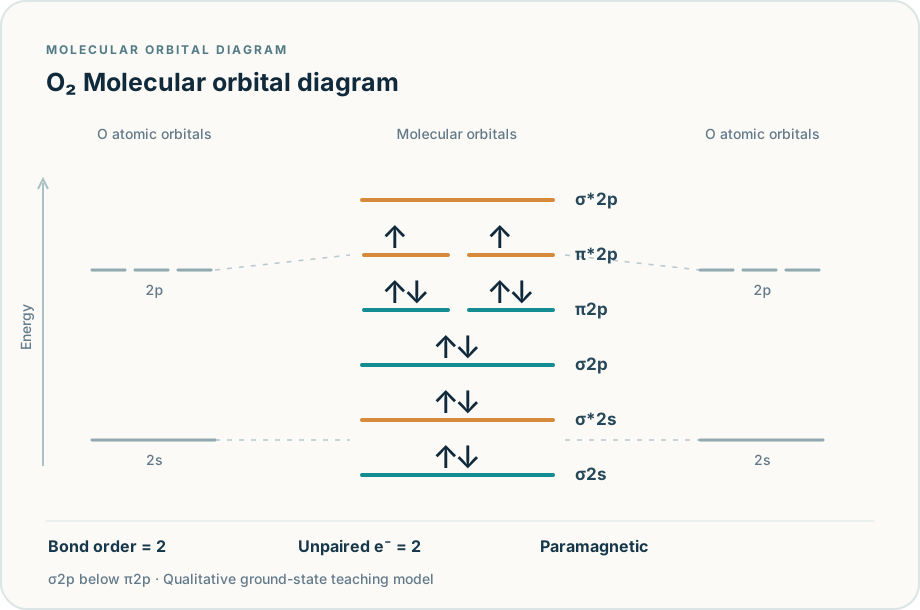
Use Factor Tree for prime factorization and GCF or LCM comparisons. Number Line shows values, fractions, and intervals; Free Body Diagram labels forces acting on an object. Bohr Model Maker shows an atom's electron shells, particle counts, isotopes, and supported ions. Use Lewis Dot Structure Generator for bonding and nonbonding electrons, formal charges, resonance, and printable chemistry practice. Use Molecular Orbital Diagram Generator for supported homonuclear diatomic molecules and ions to check σ/π filling, bond order, and magnetism, then export SVG or PNG.
Tools in this category(6)

O₂ molecular orbital diagram with two unpaired π* electrons
01

Molecular Orbital Diagram Generator

Generate MO diagrams for supported diatomic molecules and ions. Check bond order and magnetism, then export SVG or PNG.
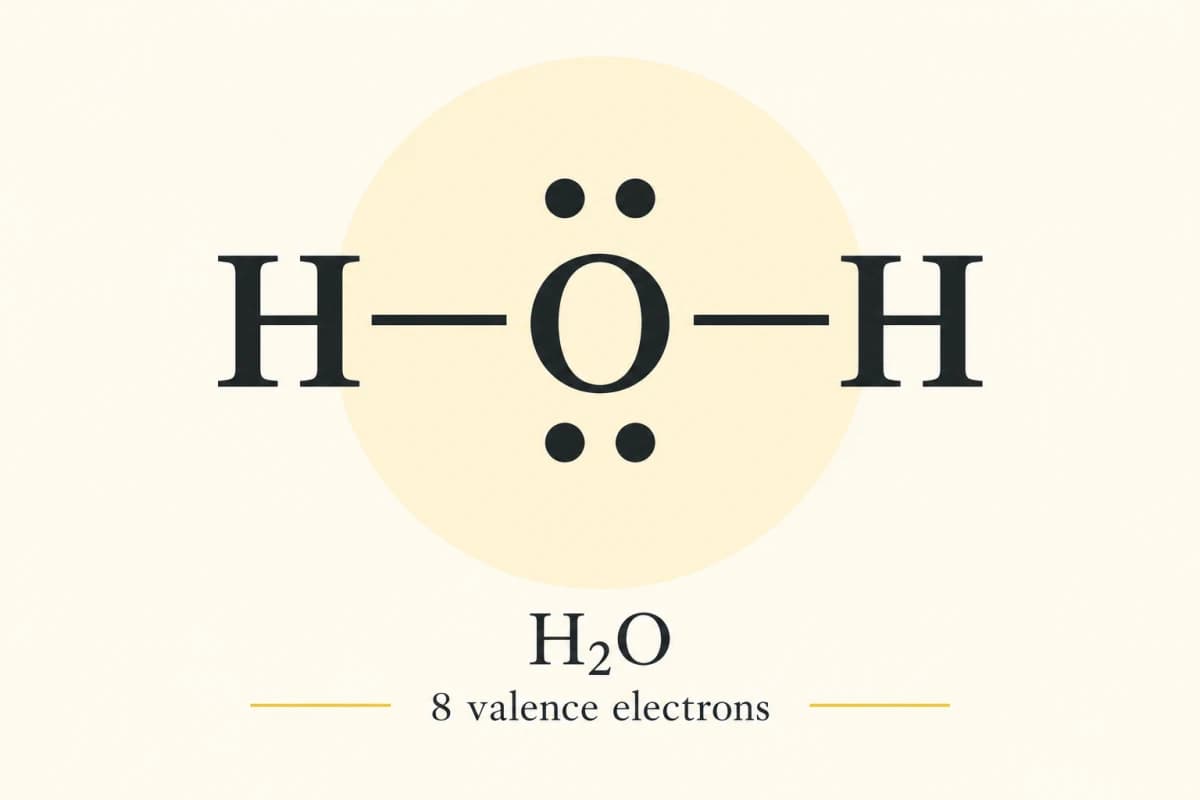
Lewis dot diagram with atoms, bond lines and nonbonding electron dots · H₂O / NO₃⁻
02

Lewis Dot Structure Generator

Generate supported Lewis diagrams, compare resonance, check electrons and export SVG or PNG.
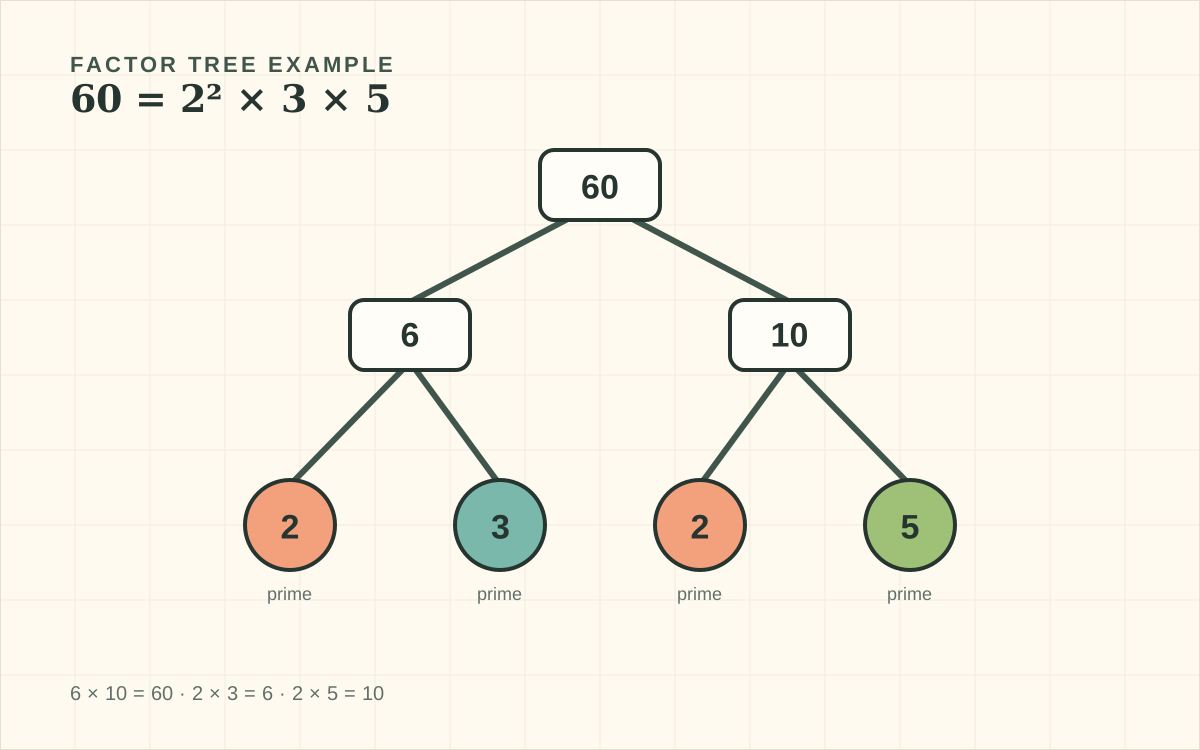
Factor tree of 60 with colored prime-number leaves
03

Factor Tree Generator

Build a visual factor tree, compare valid factor pairs, and print a prime factorization worksheet.

Quarter fractions. Mark 3/4 and shade [1/2, 3/2).
04

Number Line Generator

Set the range and tick interval, plot fractions or inequality intervals, and make a blank worksheet with its answer key. Preview instantly and export without signing up.
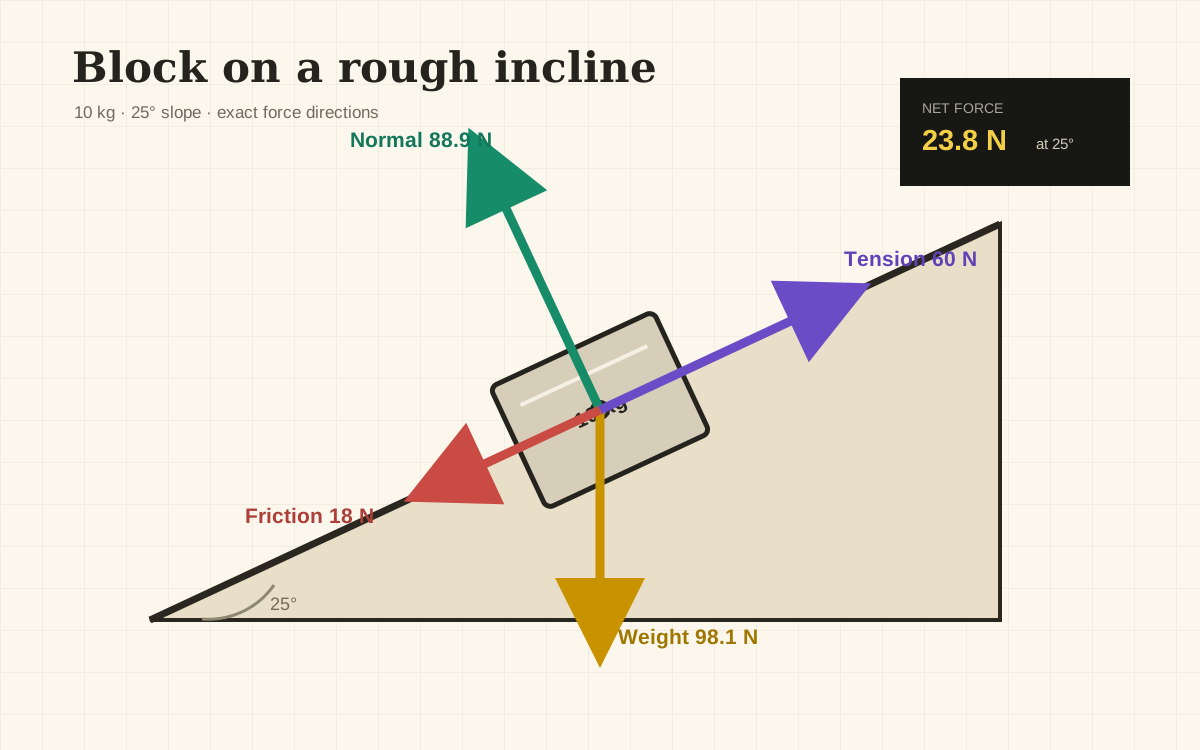
Block on an incline with weight, normal, tension, and friction vectors
05

Force Diagram Maker

Draw exact force vectors, calculate components and net force, check the setup, and export SVG or PNG.
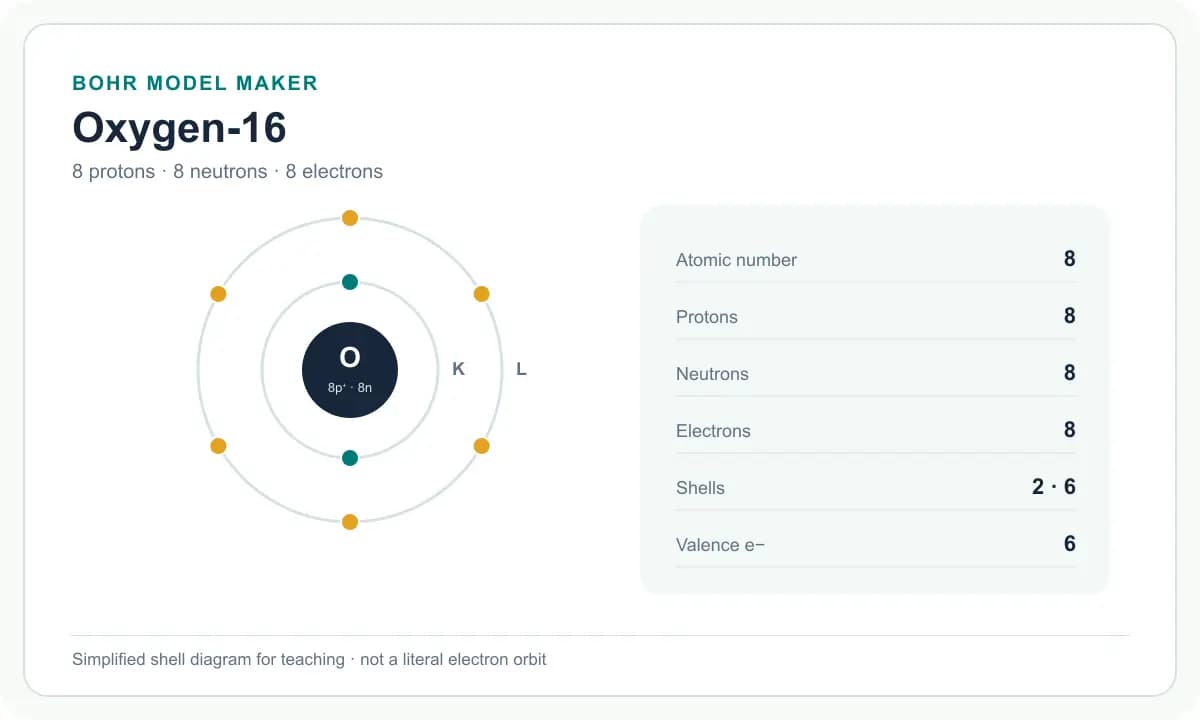
Bohr model of an atom with labeled nucleus and electron shells
06

Bohr Model Maker

Choose an element, inspect electron shells and particle counts, compare isotopes or ions, and download SVG or PNG.

Latest tools

Explore our newest tools for creating diagrams, plotting data, and preparing research figures.
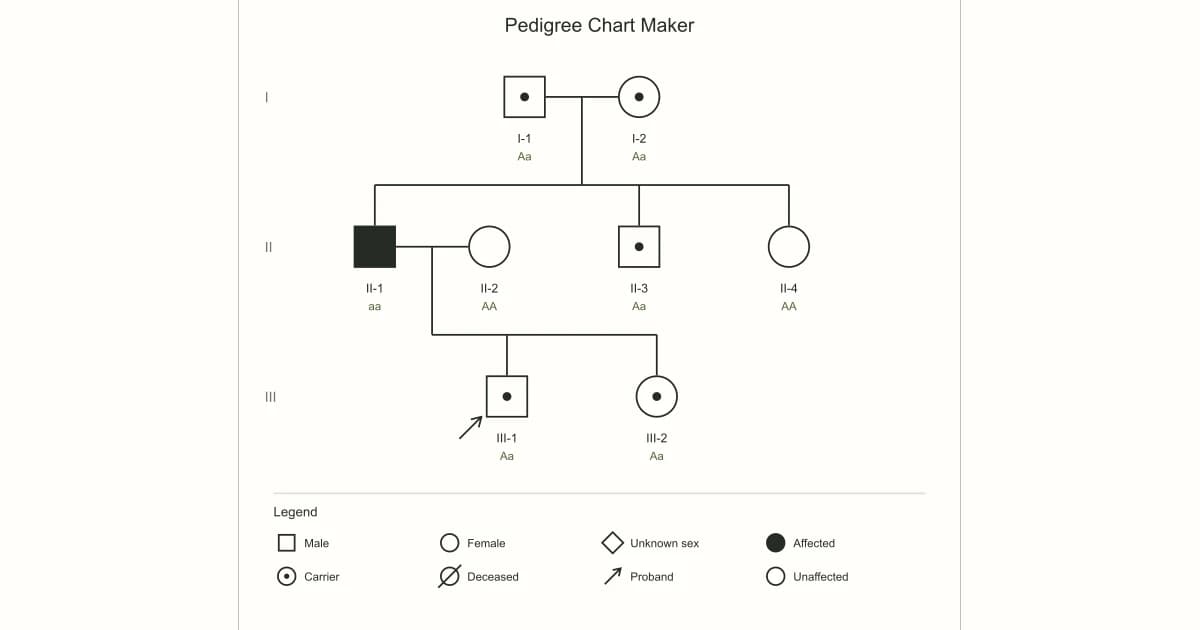
Three-generation genetic pedigree with family symbols and trait states.
01

Pedigree Chart Maker

Create free genetic family charts, label traits and genotypes, and export SVG/PNG or classroom PDF worksheets with an optional answer key.
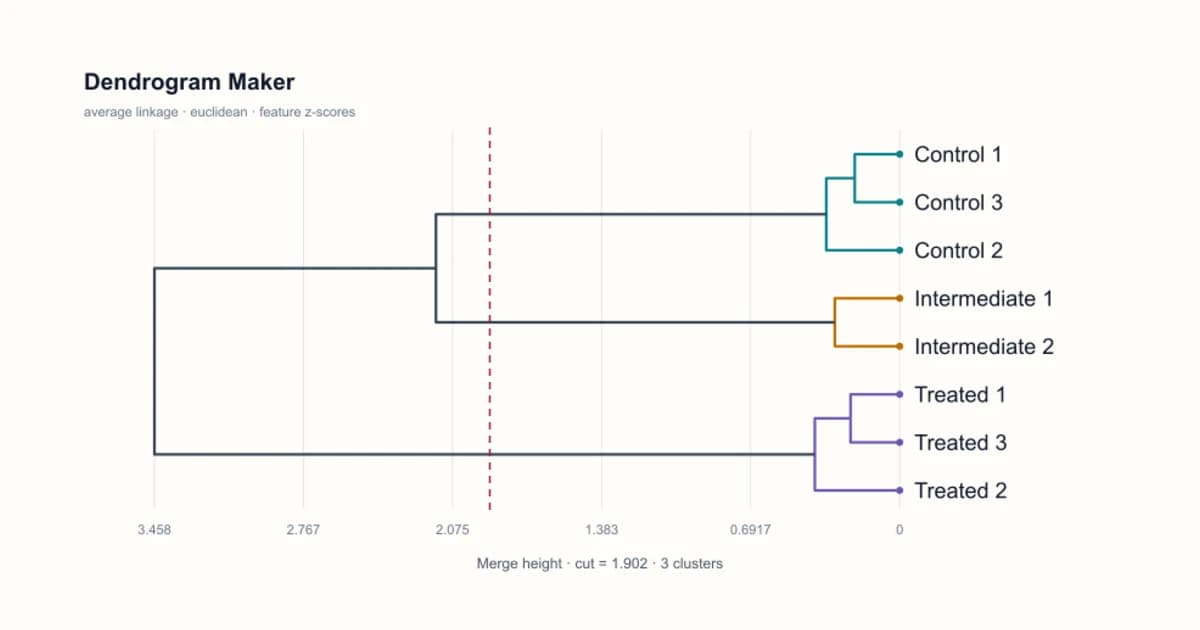
Calculated dendrogram with sample labels and merge heights.
02

Dendrogram Maker

Compute hierarchical clusters from numeric data or a distance matrix. Inspect merge heights and export SVG, PNG and result CSV.
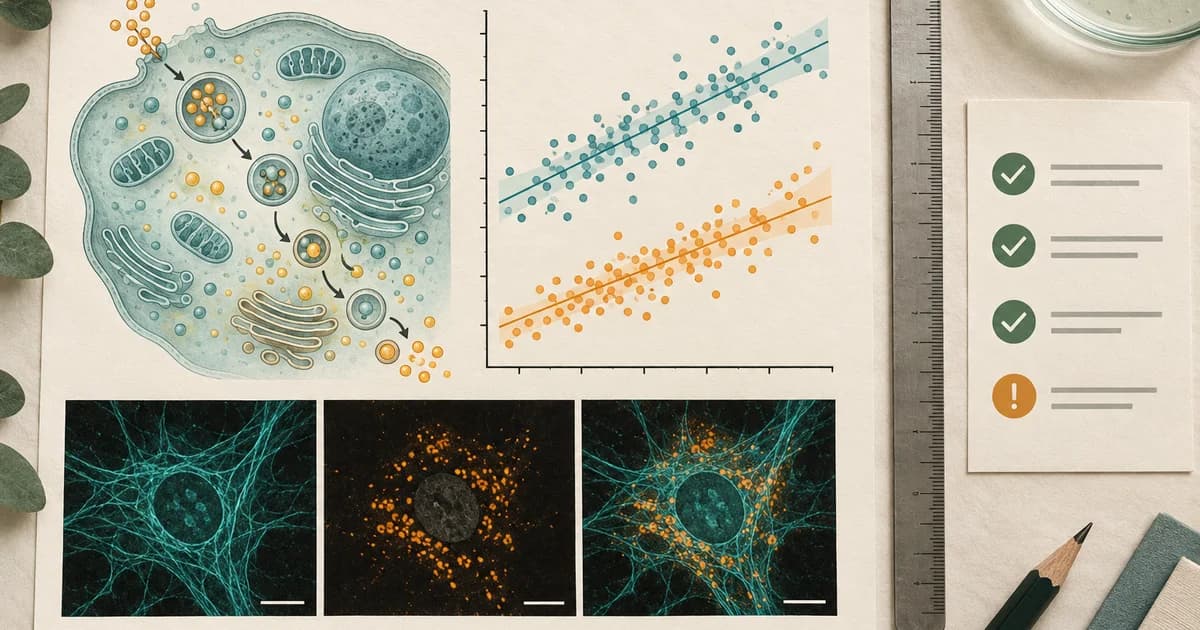
Scientific Figure Checker illustration of a research figure, ruler and submission checklist
03

Scientific Figure Checker

Scientific Figure Checker checks image DPI, pixel width, file size and format against journal profiles. Prepare PNG or JPEG exports before submission.

Browse all categories

All toolsAI Figure ToolsResearch DiagramsGraphic OrganizersData VisualizationImage & Submission