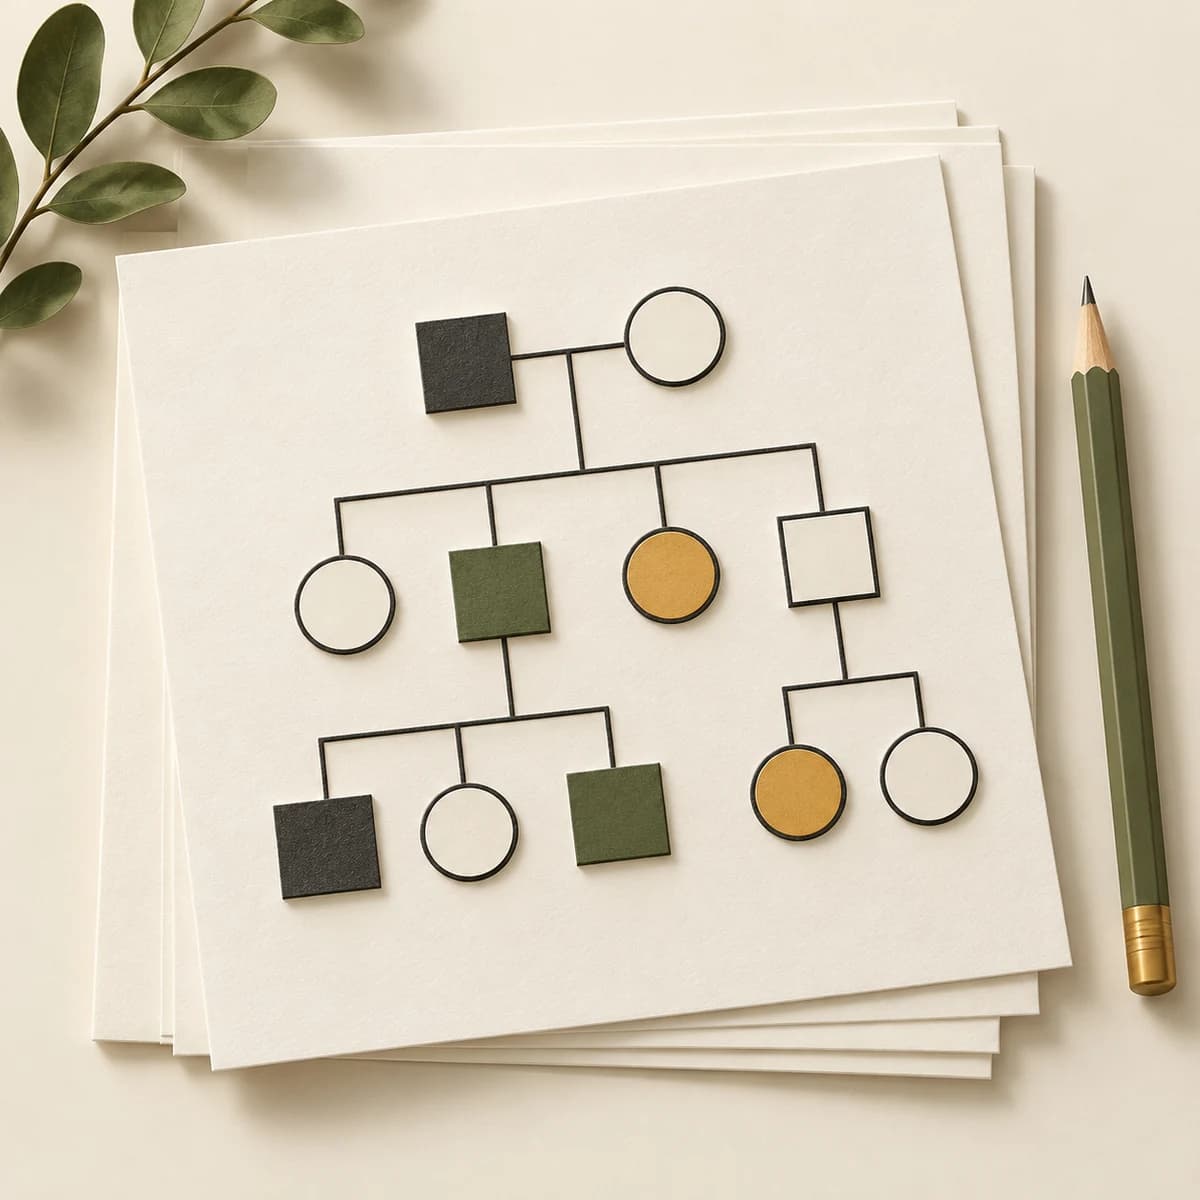
Students: Illustrate a Biology Assignment
Turn a written family scenario into a readable pedigree. Use generation labels, trait shading and optional genotypes to explain your reasoning.
Pedigree Chart Maker
Use this free Pedigree Chart Maker to draw family relationships, label traits and genotypes, and download SVG, PNG or printable classroom worksheets. Start from a template with no signup.
Family editor
Loading an example replaces the chart. Undo brings it back.
Add a relative to this member
Remove descendants first to delete a parent. One partner per member; up to 40 people.
Your chart stays in this browser tab. Save a project before leaving; refreshing clears unsaved edits. No account or credits needed.
Turn your research methods, mechanisms, and workflows into clear figures with paper banana.
A Pedigree Chart Maker helps you draw family relationships and record a trait across generations. Unlike a name-focused family tree, a genetics pedigree uses symbols and shading to make the pattern easier to read.
This online editor keeps the family structure editable. Select a member to add relatives, set their symbol and trait status, or attach a name, anonymous ID or genotype. Generation labels and relationship lines update with the chart.
Use it to illustrate information you already have. Carrier status, genotypes and affected states are entered manually; the chart does not determine inheritance or diagnose a condition.
Build families with parents, one partner per member, children and siblings. Twin, adoption, consanguinity and multiple-partner notation are not included. Export SVG for further annotation when your exercise needs those relationships.
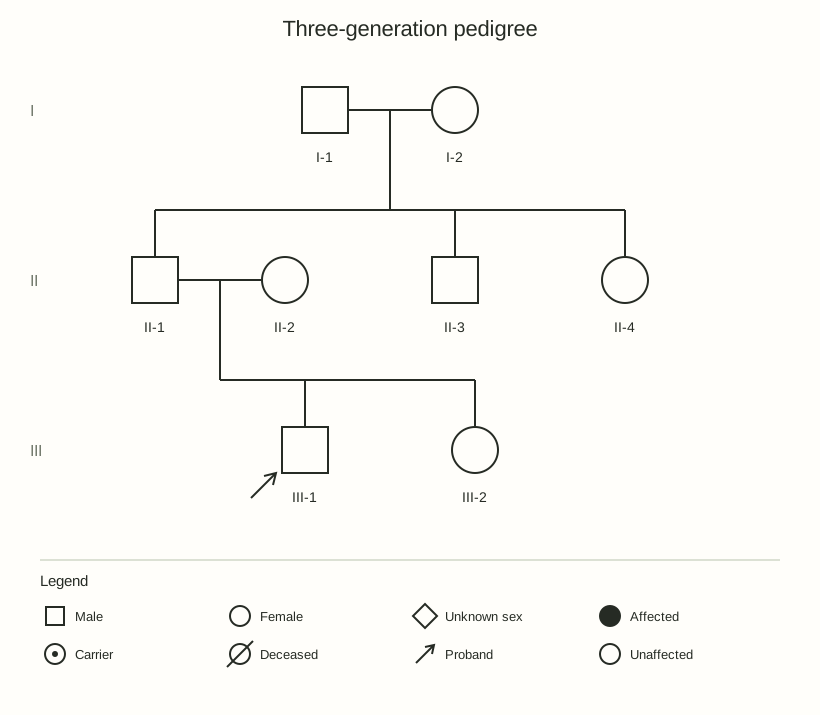
Choose a blank three-generation structure or a worked genetics example. Each chart opens in the editor with its relationships, symbols and labels intact.
For learning and communication
Build a focused genetics figure without arranging every connector by hand.
Turn a written family scenario into a readable pedigree. Use generation labels, trait shading and optional genotypes to explain your reasoning.
Turn a family scenario into a printable PDF: an unmarked chart with count questions, an observation sheet and an optional answer page. It supports up to 16 people and four generations.
Hide member names or genotype labels and keep generation IDs visible. Download SVG for slides or vector editing, and check the chart title and other labels before sharing.
A focused pedigree drawing tool
Relationships and annotations stay connected as you add people and adjust their symbols.
Add parents, a partner, a child or a sibling to the selected member. The chart places generations and draws relationship lines automatically. Families can have up to 40 people.
Try Pedigree Chart MakerUse squares, circles and diamonds for sex, solid fill for affected members, a central dot for carriers, a slash for deceased members and an arrow for the proband.
Try Pedigree Chart Maker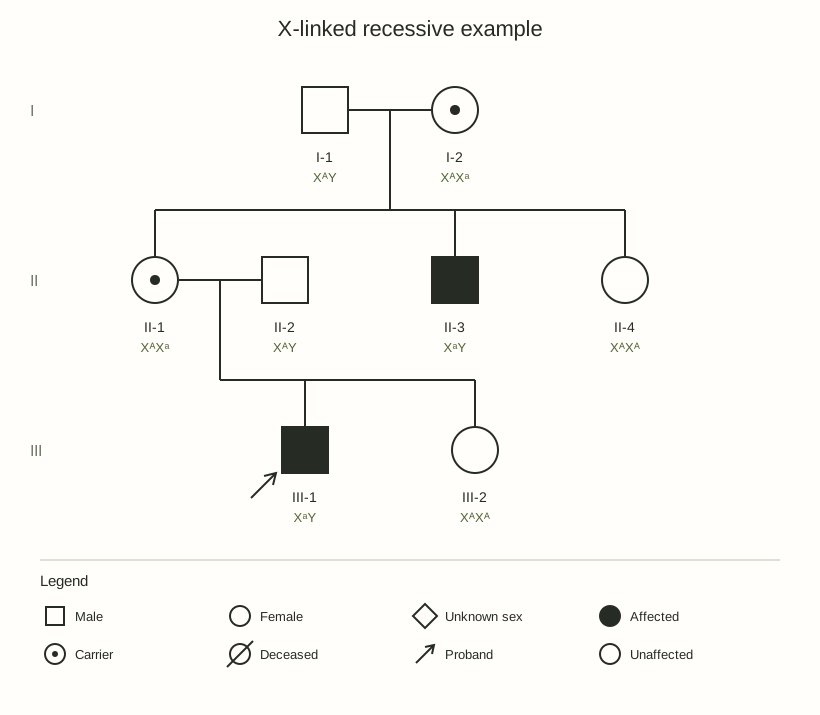
Download a clean SVG or PNG with its legend. Save a JSON project to reopen and edit the family later; undo and redo help you explore changes safely.
Try Pedigree Chart MakerDownload a two-page student PDF with an unmarked pedigree, four count questions and a member observation table. Add a separate answer page with your annotations and counts. PDF worksheets omit names and replace the title, and they support up to 16 people and four generations. No inheritance answers are inferred.
Try Pedigree Chart Maker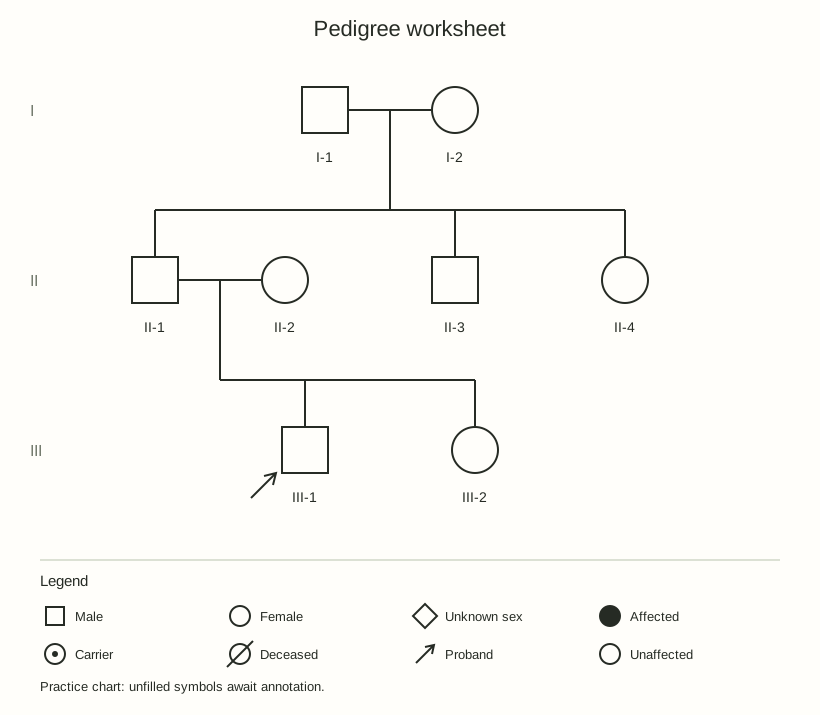
Hide member names or genotypes, or switch to practice view to clear trait fills, carrier dots and genotype answers. These controls apply to the preview and SVG/PNG exports without deleting data. Saved JSON projects keep all entries, and PDF worksheets use the full observations whatever these switches show.
Try Pedigree Chart MakerThree steps
Build the structure first, add the trait details, then export your finished chart.
Load a template or start blank. Select a member and add parents, a partner, children or siblings to build your family structure.
Choose sex and trait status. Add genotypes if known, mark the proband and check that each member connects to the correct parents.
Export SVG or PNG using your display settings. For classroom practice, download a PDF worksheet with observations and an optional answer key. Save a project file to keep editing later.
Related tools for other biology figures
Pick the tool that fits each kind of relationship you want to show.
Your questions, answered
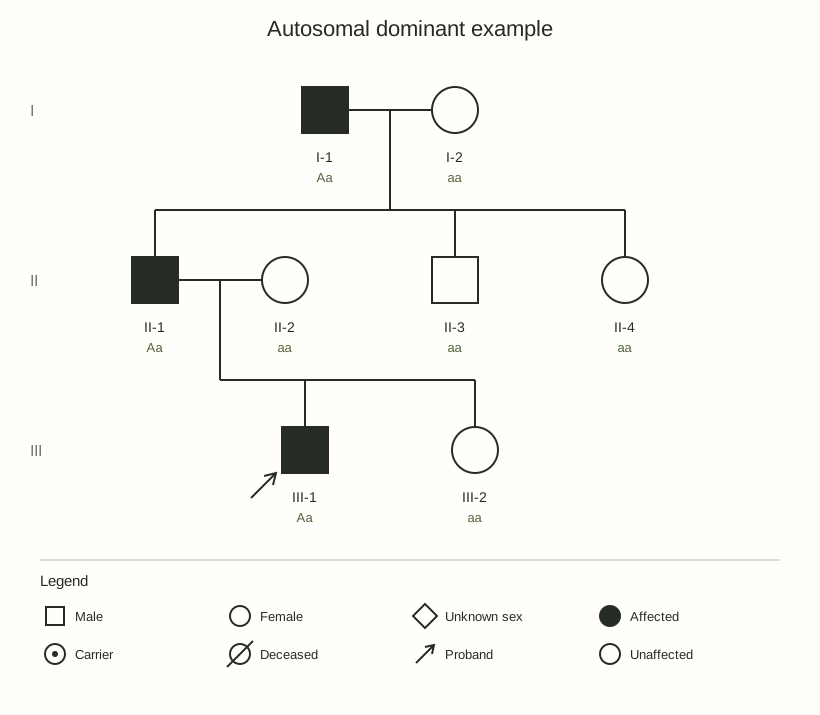
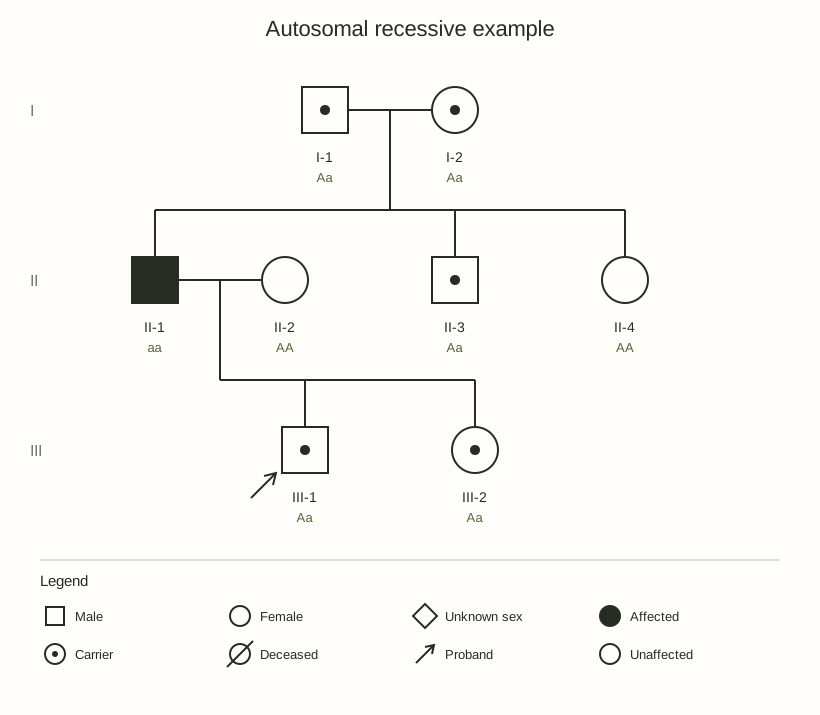
Use the three-generation template to enter your own family scenario. For a worked example, choose autosomal dominant, autosomal recessive or X-linked recessive. Each example opens with editable relationships and supplied trait states. Check your assignment before changing labels. These examples show supplied information and do not infer an inheritance pattern.
Start with a template or a blank family. Select a member and add parents, one partner, children or siblings. Set sex symbols and trait states, then enter optional genotypes. The editor arranges up to 40 people automatically. Review the relationships before downloading your chart.
You can create and edit pedigree charts, start from four templates, download SVG or PNG files, print PDF worksheets, and save or reopen JSON projects. No payment, credits or signup is needed. The editor supports 40 people; classroom PDF worksheets support up to 16 people across four generations.
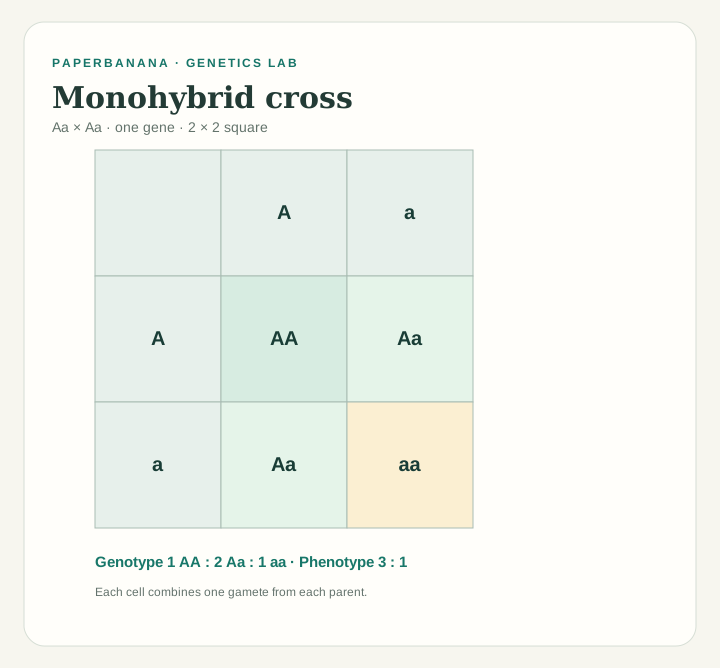
Select a family member and enter a known genotype, such as Aa, in the genotype field. Mark affected or carrier status separately, because neither field calculates the other. Genotypes are optional labels, not inferred results. The editor does not calculate genetic risk.
A proband is the person whose genetic condition or concern about risk prompts a family investigation. Select that member and enable Proband to display an arrow. The editor marks one proband at a time; the arrow identifies the reference person and does not itself indicate whether they are affected.
Enter the family observations, then choose Download worksheet PDF. The two student pages contain an unmarked chart, four count questions and an observation table. Turn on Include answer key to add a third page with your entries and counts. Worksheets support 16 people and four generations; the key does not validate or infer genotypes.
Choose the Three generations template and edit its members. Download SVG or PNG to print with your usual software, or choose the worksheet PDF for classroom practice. Save a JSON project to keep relationships and annotations editable. Opening a saved project restores the file; refreshing the page clears unsaved edits.
Turn on Hide member names or Hide genotypes to hide them in the preview and SVG or PNG exports. Practice view also hides trait answers. PDFs omit names and replace the title. Saved JSON projects keep all entries. Review labels before sharing. Chart data stays in this browser tab and is not uploaded or saved automatically.
From family story to clear figure
Start with a template, edit each member and export a figure you can use.